Projects#
This page shows stats about the Open Seeds projects
import matplotlib.pyplot as plt
import pandas as pd
from wordcloud import WordCloud
baseurl = "https://raw.githubusercontent.com/open-life-science/open-life-science.github.io/main/_data/artifacts/openseeds/"
project_df = (
    pd.read_csv(f"{baseurl}projects.csv", index_col=0, na_filter= False)
    .assign(
        participants=lambda df: df.participants.str.split(", "),
        participantNb=lambda df: df.participants.str.len(),
        mentors=lambda df: df.mentors.str.split(", "),
        keywords=lambda df: df.keywords.str.split(", "),
        cohort=lambda df: "OLS-" + df.cohort.astype(str),
    )
)
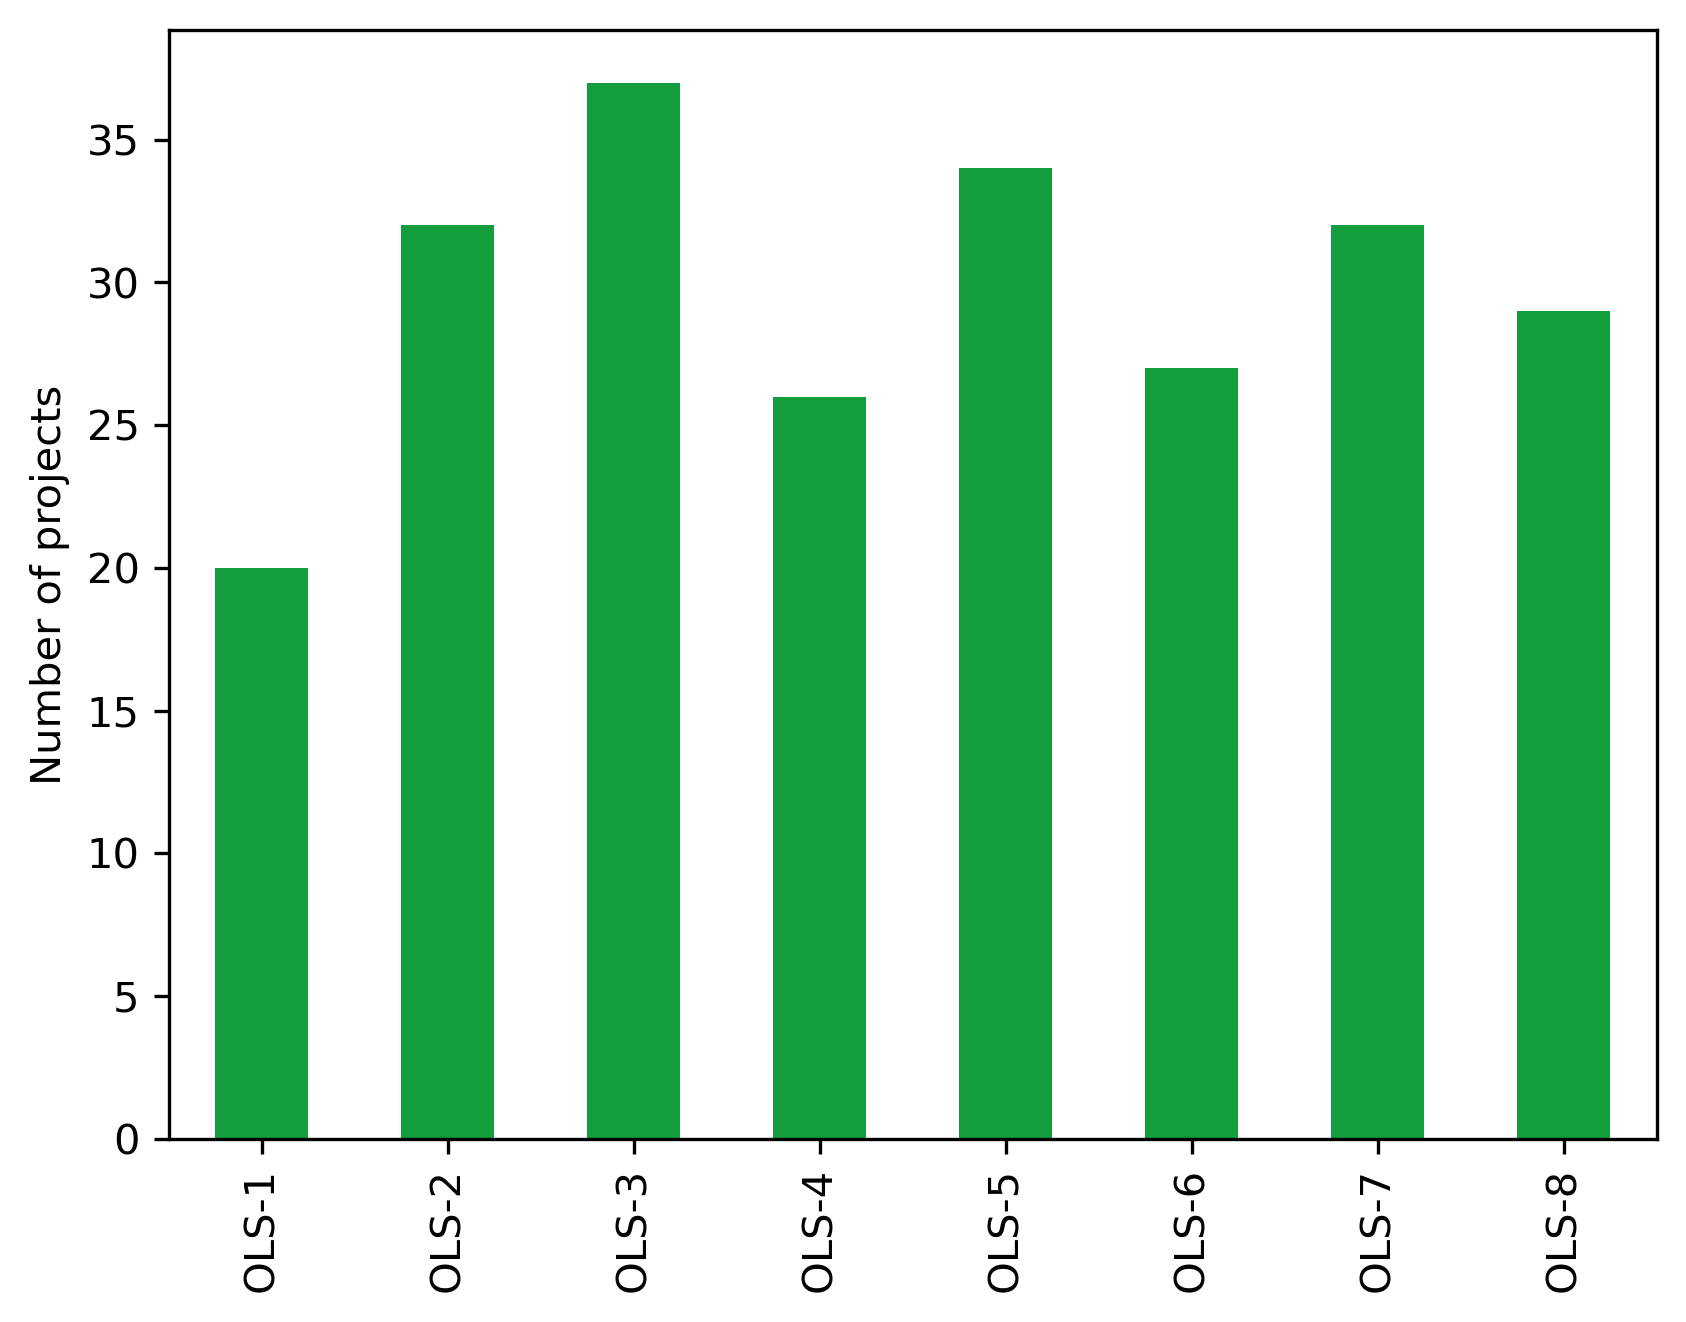
Number of projects over all cohorts
len(project_df)
237
Cohorts#
cohort_df = (
    project_df
    .groupby(by="cohort")
    .count()
    .drop(columns = ["participants", "mentors", "description", "keywords", "status", "collaboration", "participantNb"])
    .rename(columns = {"name": "Total"})
)
Mean number of projects per cohort
cohort_df.Total.mean()
29.625
fig, ax = plt.subplots()
fig.set_dpi(300)
(cohort_df.Total
     .transpose()
     .plot.bar(ax=ax, color="#139D3D"))
plt.ylabel("Number of projects")
plt.xlabel("")
Text(0.5, 0, '')
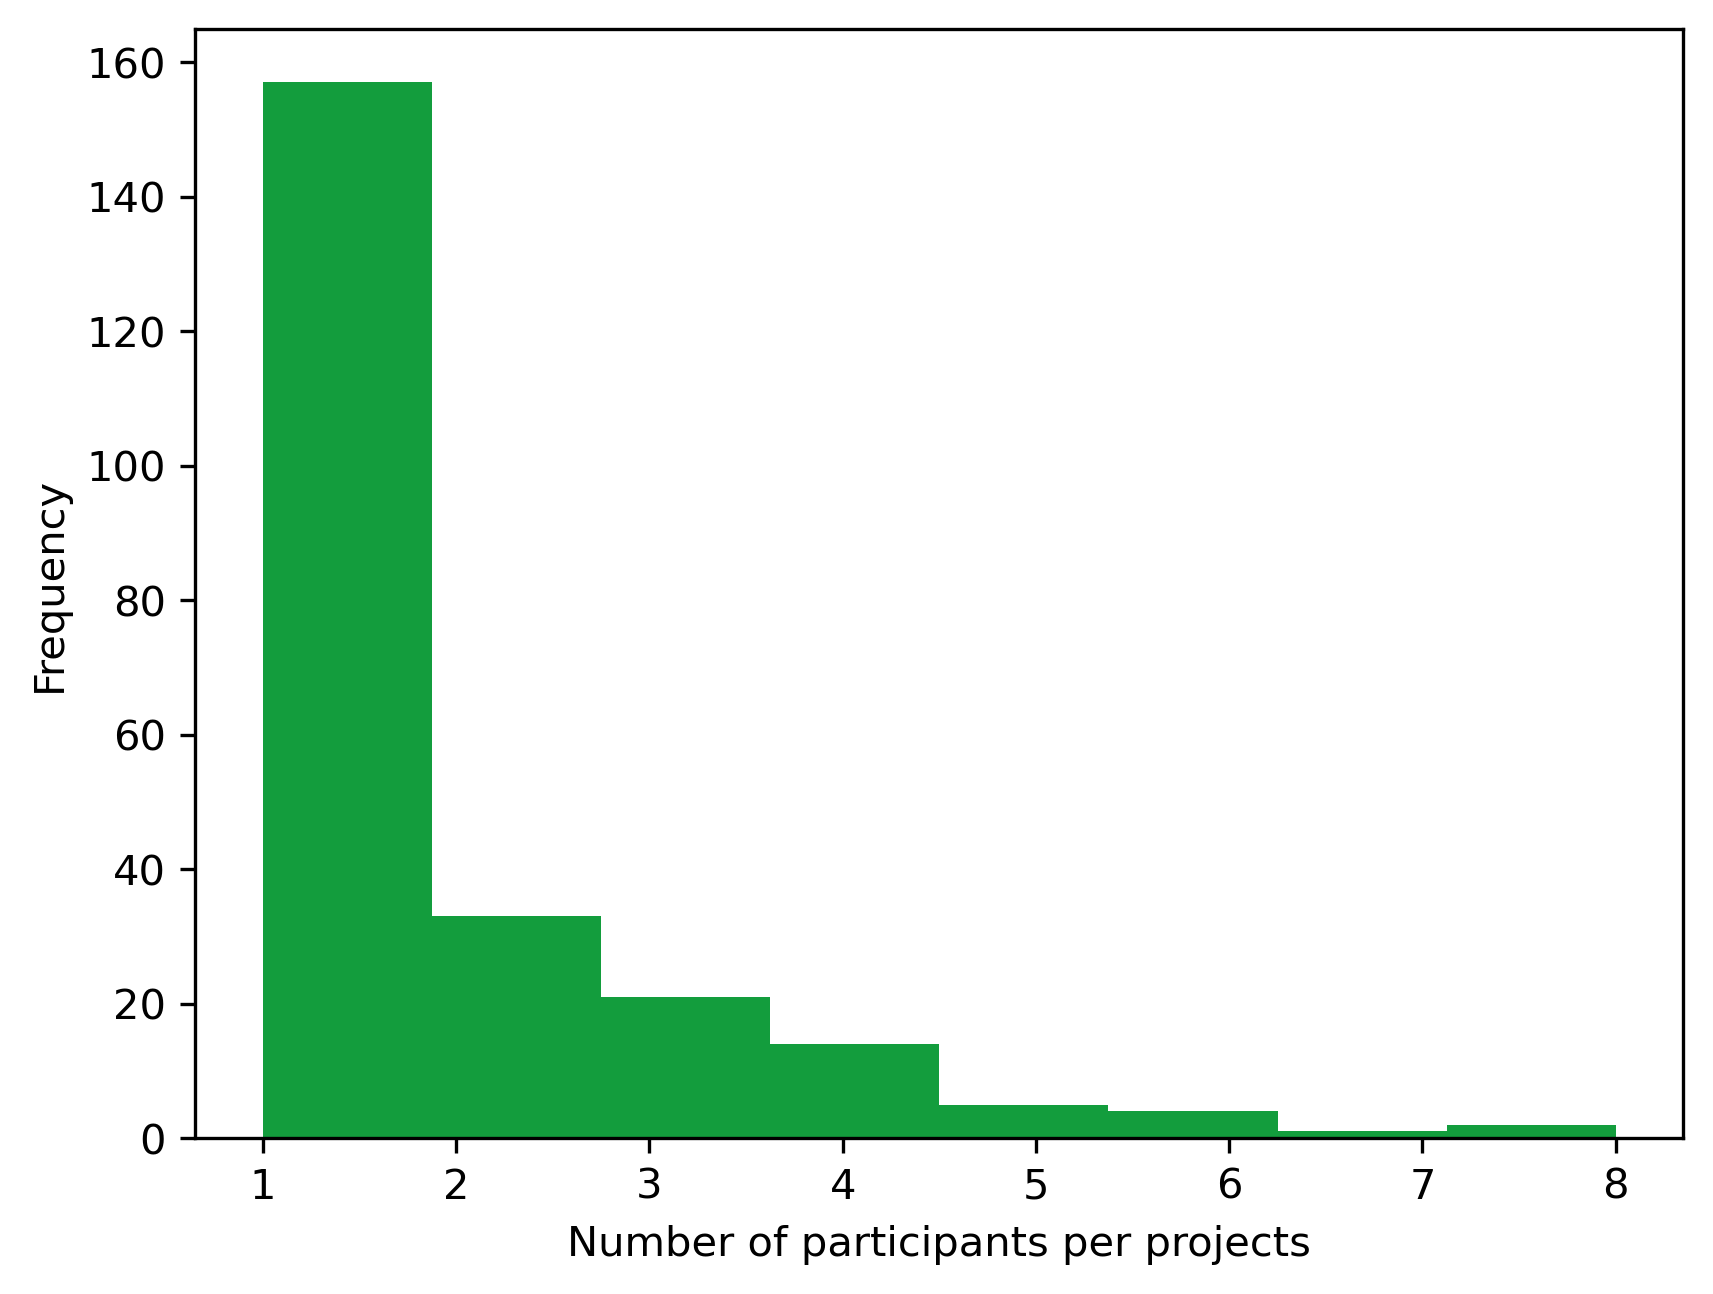
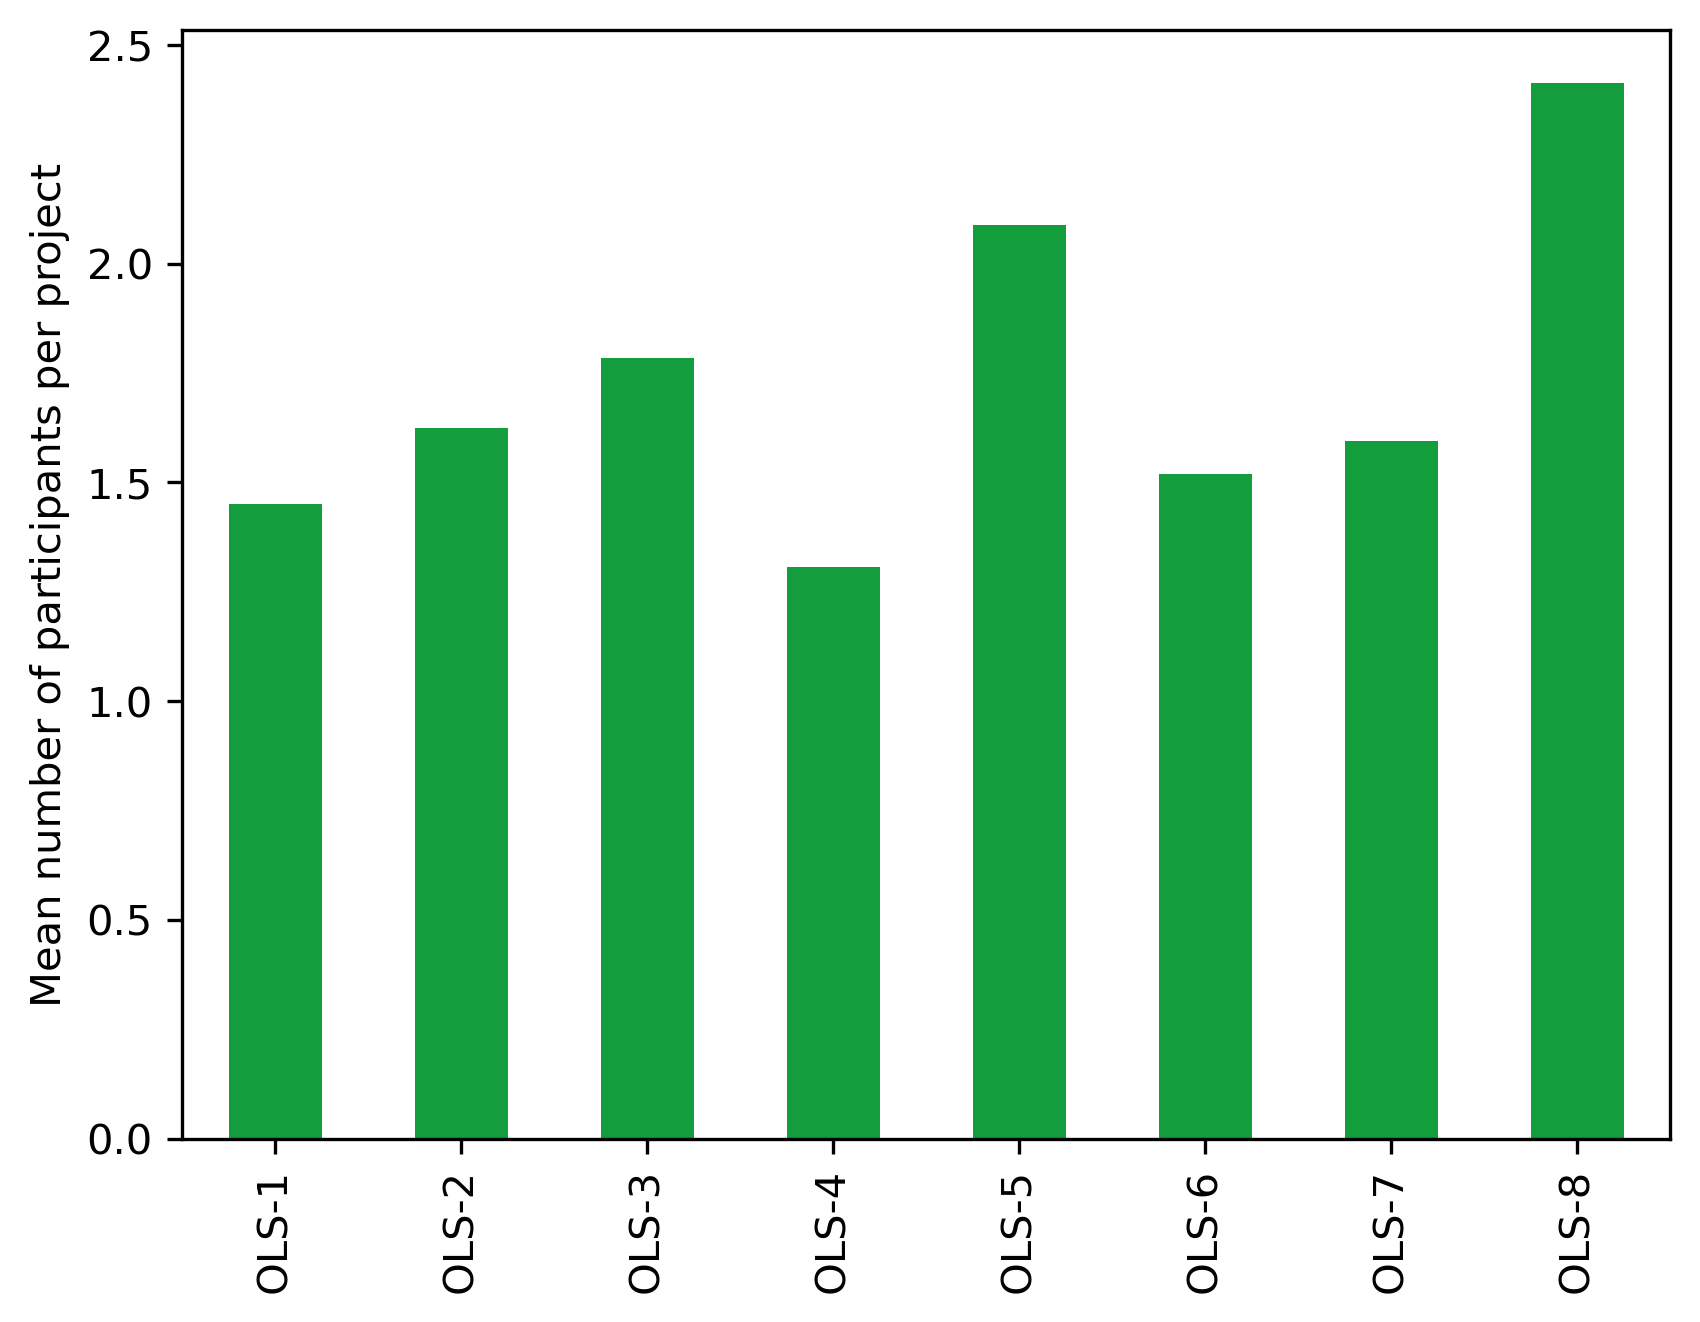
Participants#
Mean number of participants per projects
project_df.participantNb.mean()
1.7468354430379747
Distribution of the number of participants per project
fig, ax = plt.subplots()
fig.set_dpi(300)
project_df.participantNb.plot.hist(
    bins=8, ax=ax, legend=False, color="#139D3D"
)
plt.xlabel('Number of participants per projects')
Text(0.5, 0, 'Number of participants per projects')
cohort_df = (project_df
    .drop(columns = ["name", "participants", "mentors", "description", "keywords", "status", "collaboration"])
    .groupby(by="cohort")
    .mean()
)
fig, ax = plt.subplots()
fig.set_dpi(300)
(cohort_df.participantNb
     .transpose()
     .plot.bar(ax=ax, color="#139D3D"))
plt.ylabel("Mean number of participants per project")
plt.xlabel("")
Text(0.5, 0, '')
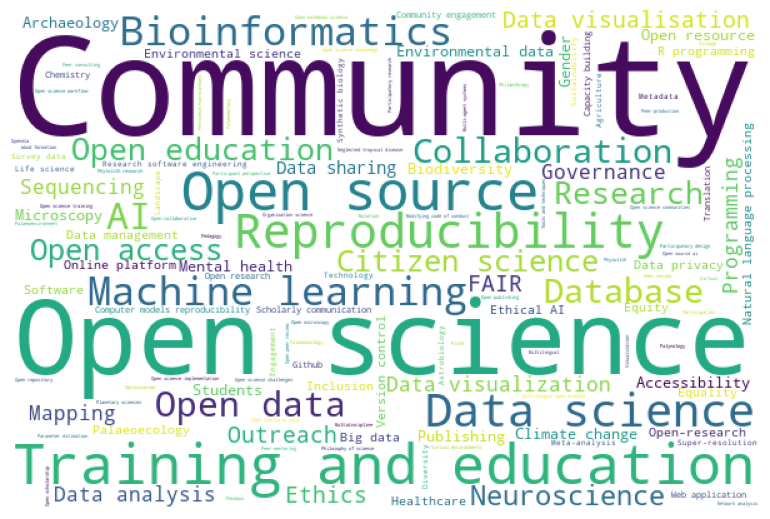
Keywords#
keyword_df = (project_df
    .drop(columns = ["participantNb", "participants", "mentors", "description", "status", "cohort", "collaboration"])
    .explode("keywords")
    .assign(keywords=lambda df: df.keywords.str.capitalize())
    .replace("Community building", "Community")
    .replace("Research community", "Community")
    .replace("Ethics of ai", "Ethical AI")
    .replace("Ethical ai", "Ethical AI")
    .replace("Enviromental", "Environmental science")
    .replace("Equal opportunity", "Equality")
    .replace("Training", "Training and education")
    .replace("Education", "Training and education")
    .replace("Artificial intelligence", "AI")
    .replace("Ai", "AI")
    .replace("Fair", "FAIR")
    .replace("Open-source", "Open source")
    .replace("Open source software", "Open source")
    .replace("Opensource", "Open source")
    .replace("Os", "Open source")
    .replace("Open source projects", "Open source")
    .replace(" data science", "Data science")
    .replace("Visualisation", "Data visualisation")
    .replace("Next-generation sequencing", "Sequencing")
    .replace("Open educational resource", "Open education")
    .replace("Reproducible research", "Reproducibility")
    .replace("Data", "Data science")
    .replace("Open community", "Community")
    .groupby(by="keywords")
    .count()
    .rename(columns={"name": "Frequency"})
    .sort_values("Frequency", ascending=False)
)
keyword_df.head(10)
| Frequency | |
|---|---|
| keywords | |
| 63 | |
| Community | 35 |
| Open science | 19 |
| Training and education | 19 |
| Open source | 18 |
| Reproducibility | 13 |
| Data science | 12 |
| Machine learning | 9 |
| Bioinformatics | 9 |
| AI | 8 |
frec = keyword_df.Frequency.to_dict()

wc = WordCloud(
    background_color="rgba(255, 255, 255, 0)",
    random_state=42,
    width=600,
    height=400,
)

wordcloud = wc.generate_from_frequencies(frec)

fig, ax = plt.subplots(figsize=(13, 5))
ax.imshow(wc)

plt.axis("off")
plt.tight_layout(pad=0)
plt.show()