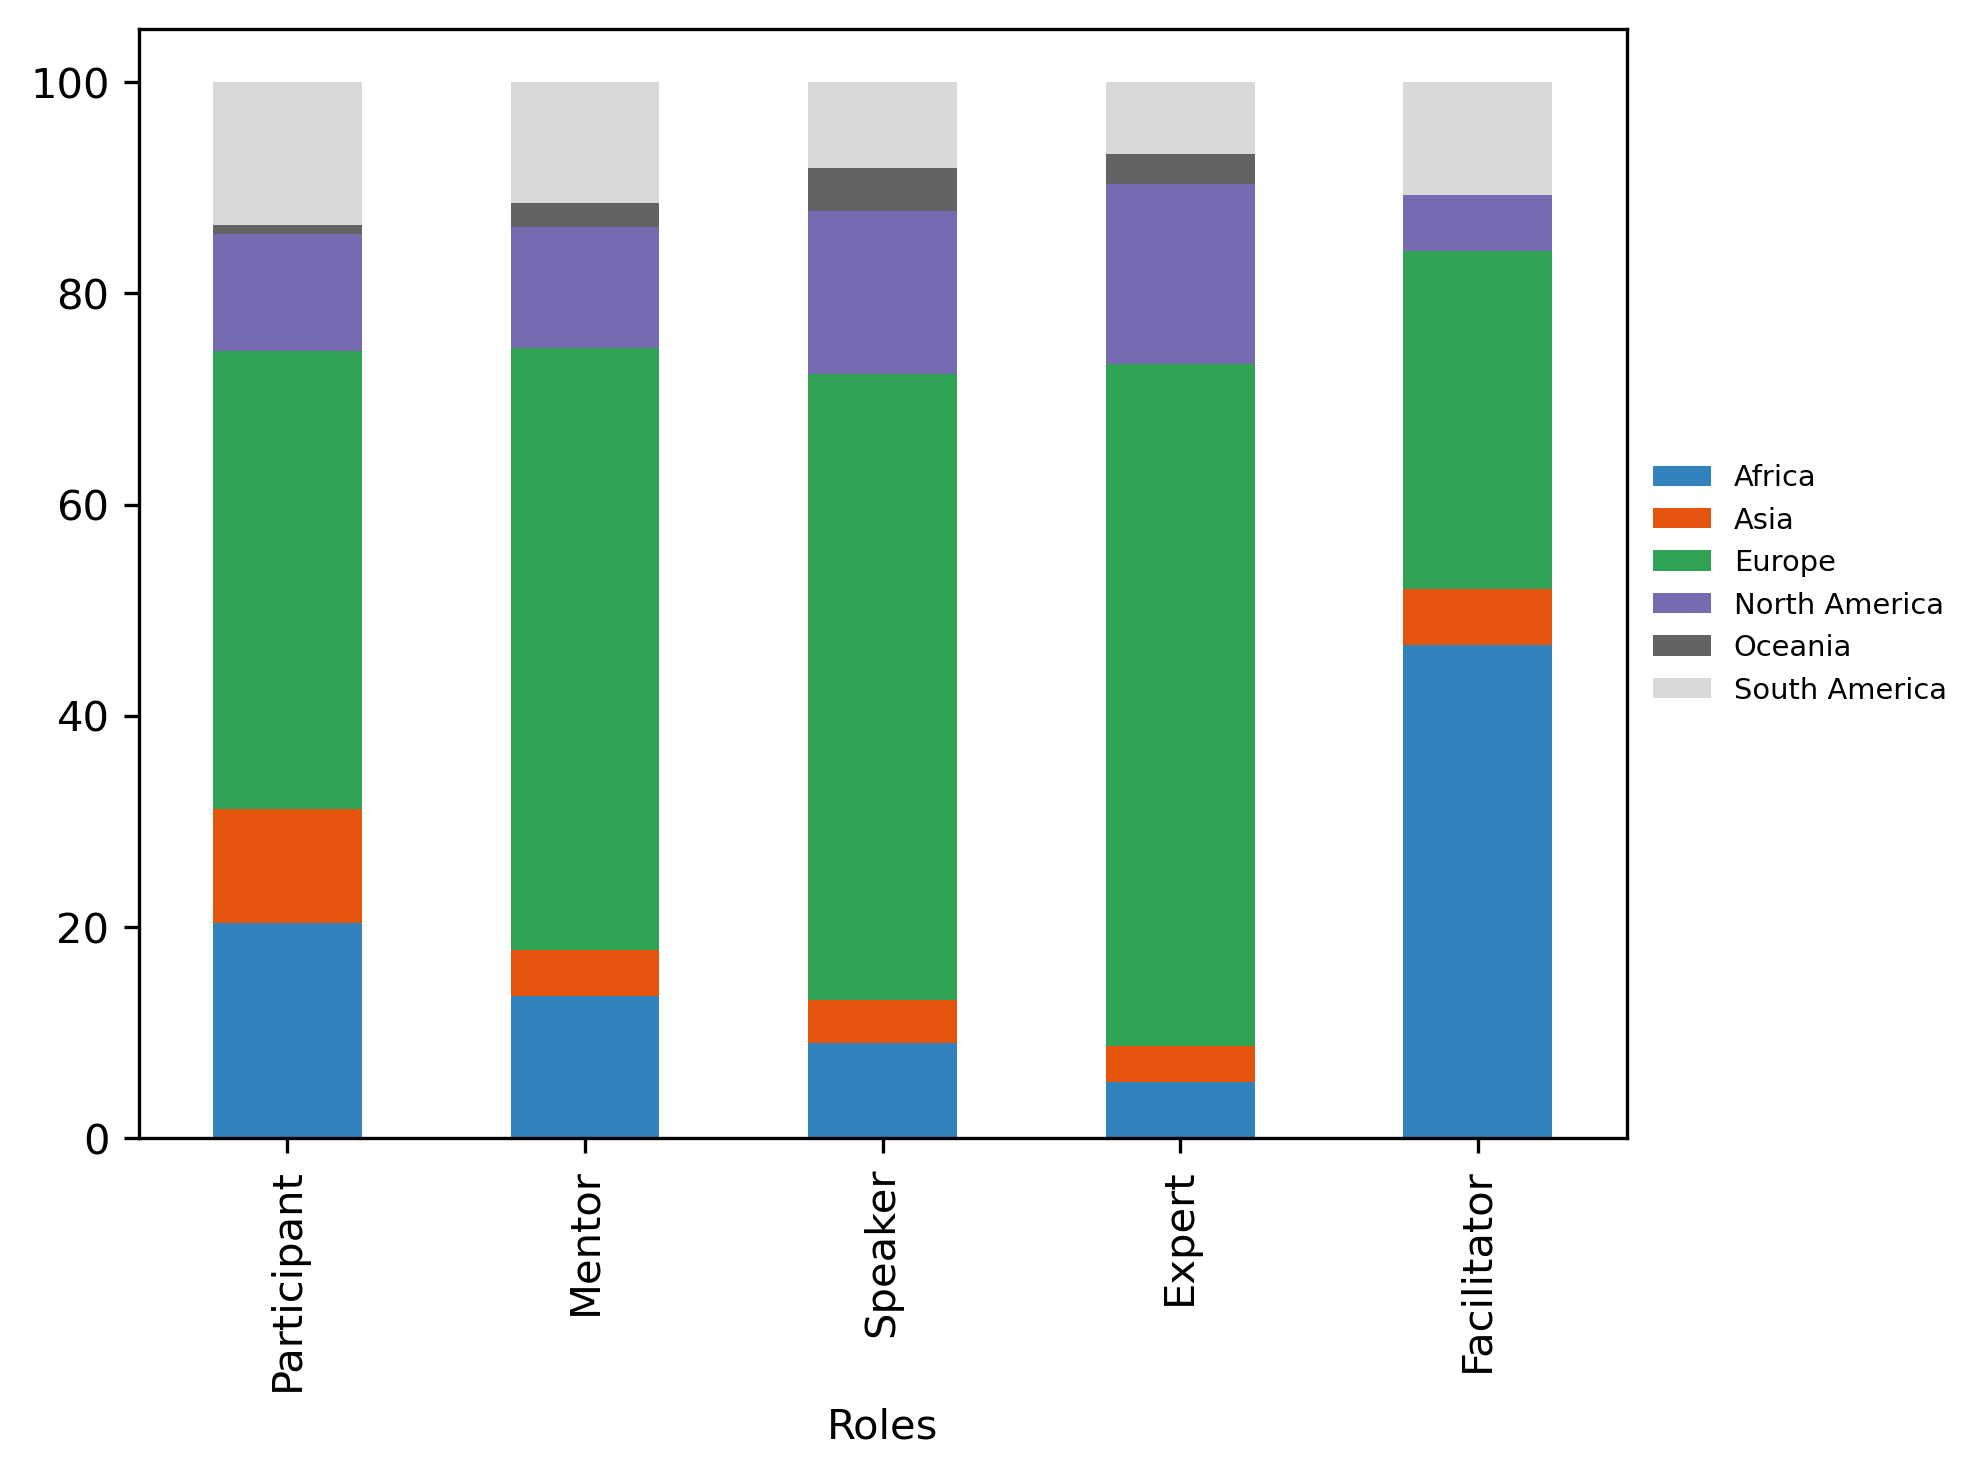
Location of people
This page shows the location (by continent or country) of the Open Seeds people given their different roles
/tmp/ipykernel_2047/3598637579.py:1: FutureWarning: The geopandas.dataset module is deprecated and will be removed in GeoPandas 1.0. You can get the original 'naturalearth_lowres' data from https://www.naturalearthdata.com/downloads/110m-cultural-vectors/.
  path = geopandas.datasets.get_path('naturalearth_lowres')
Continents
Proportion of people without continent information
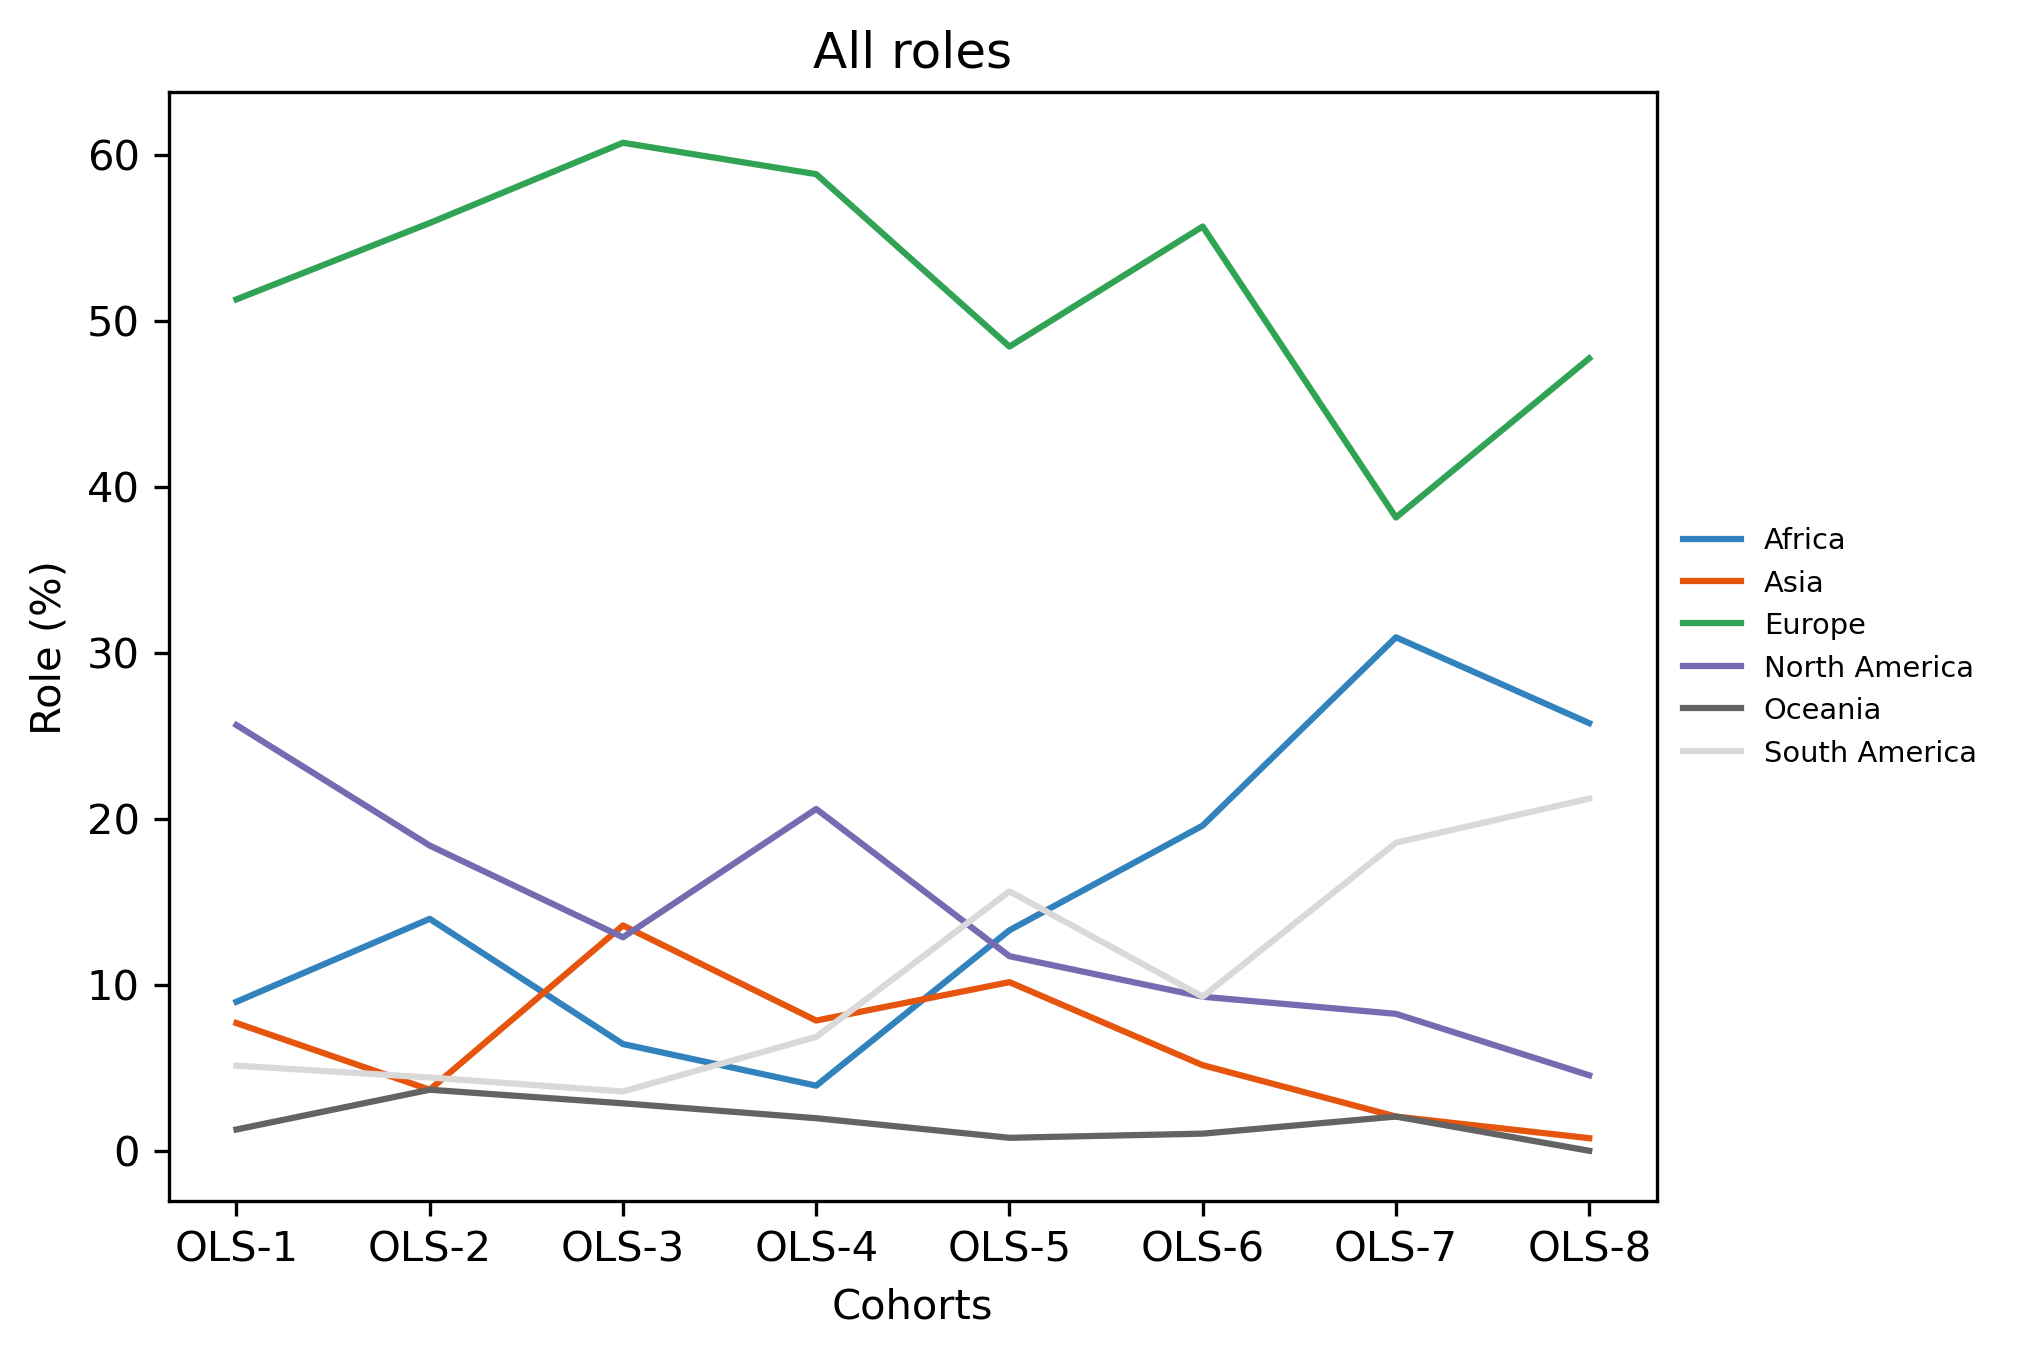
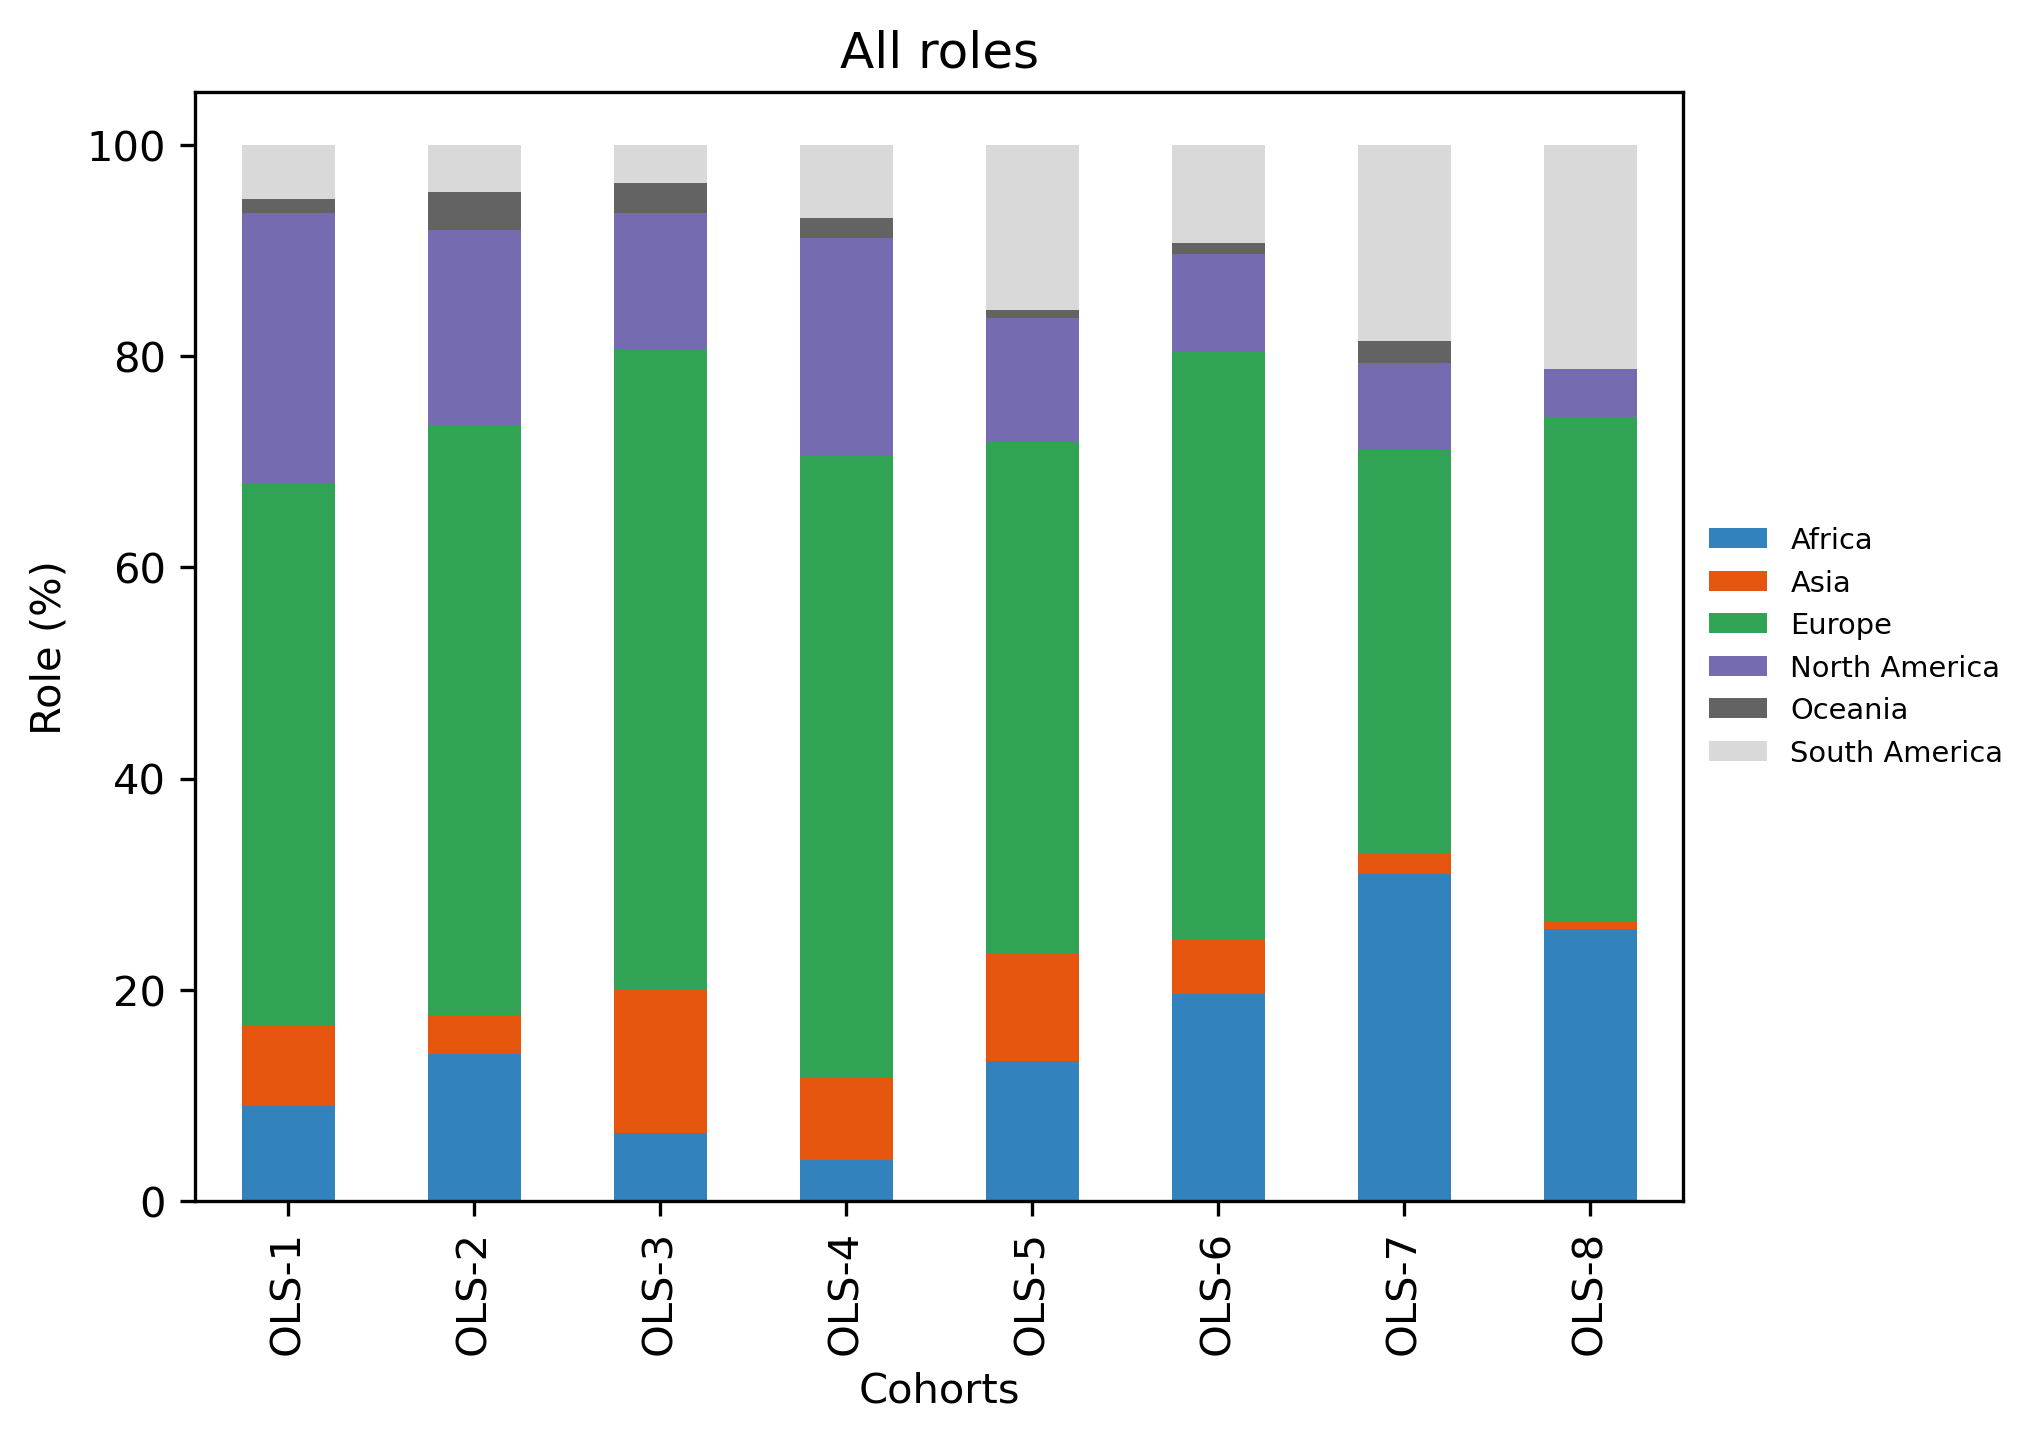
All roles
|
TOTAL |
OLS-1 |
OLS-2 |
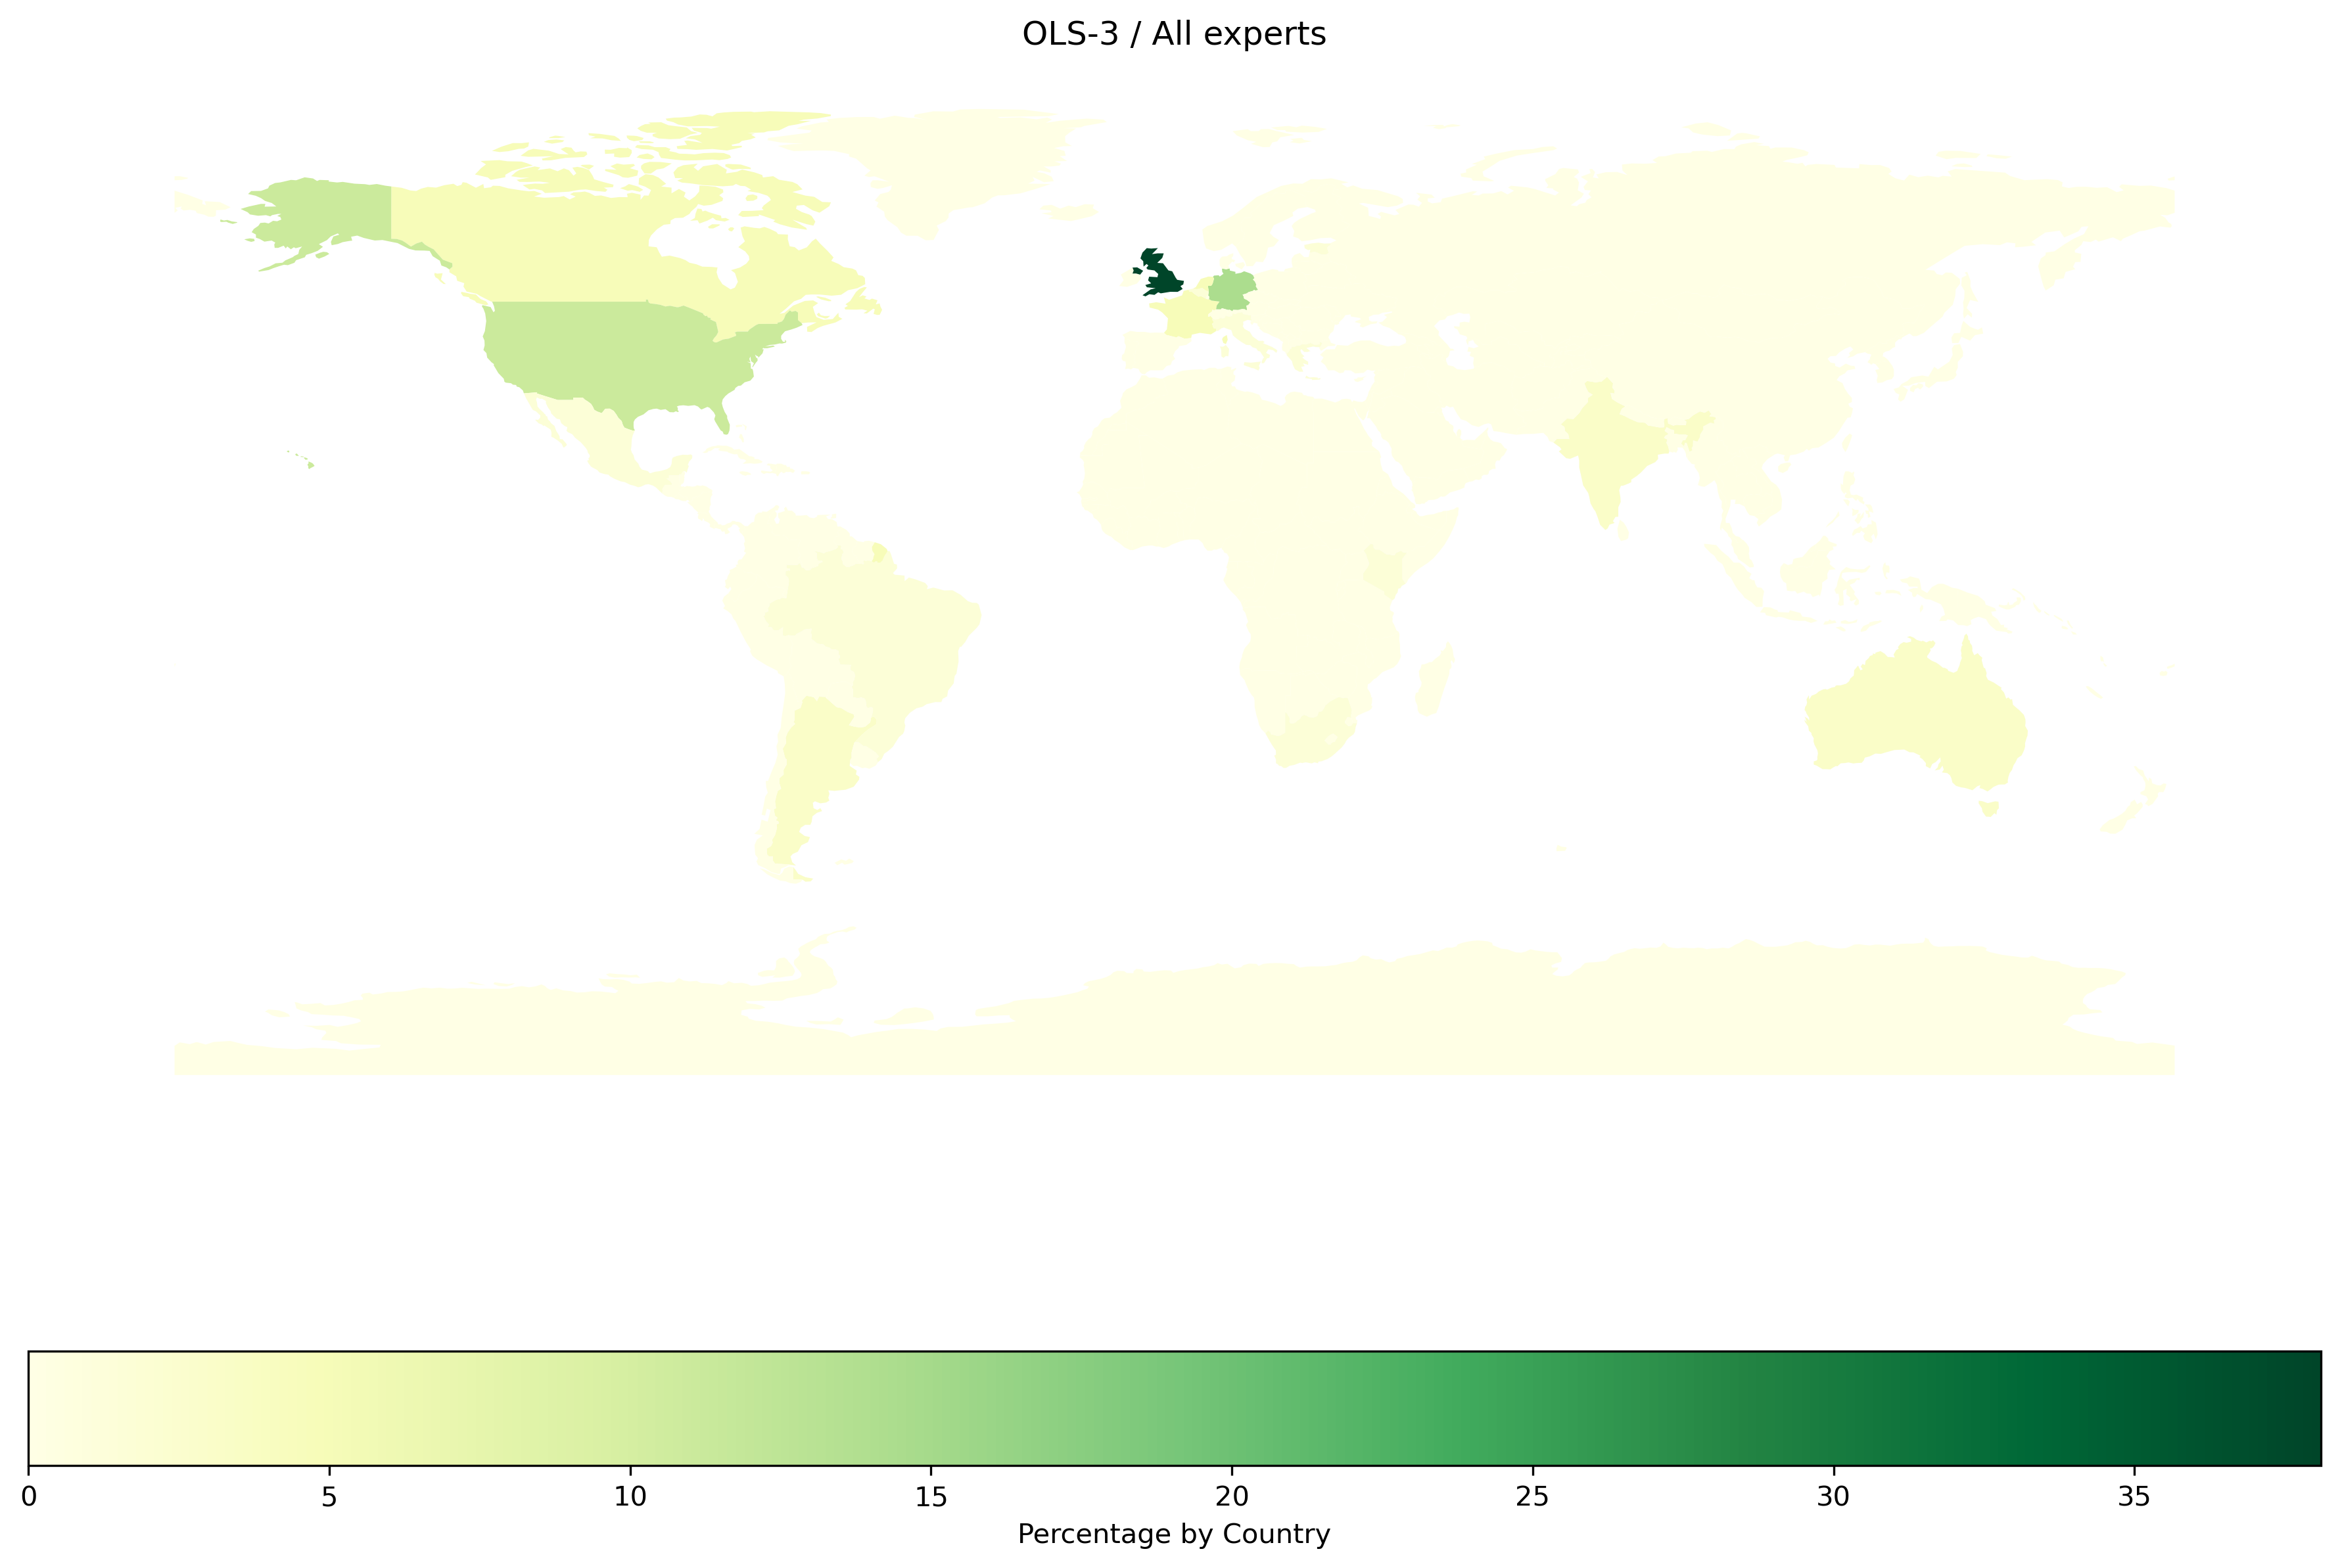
OLS-3 |
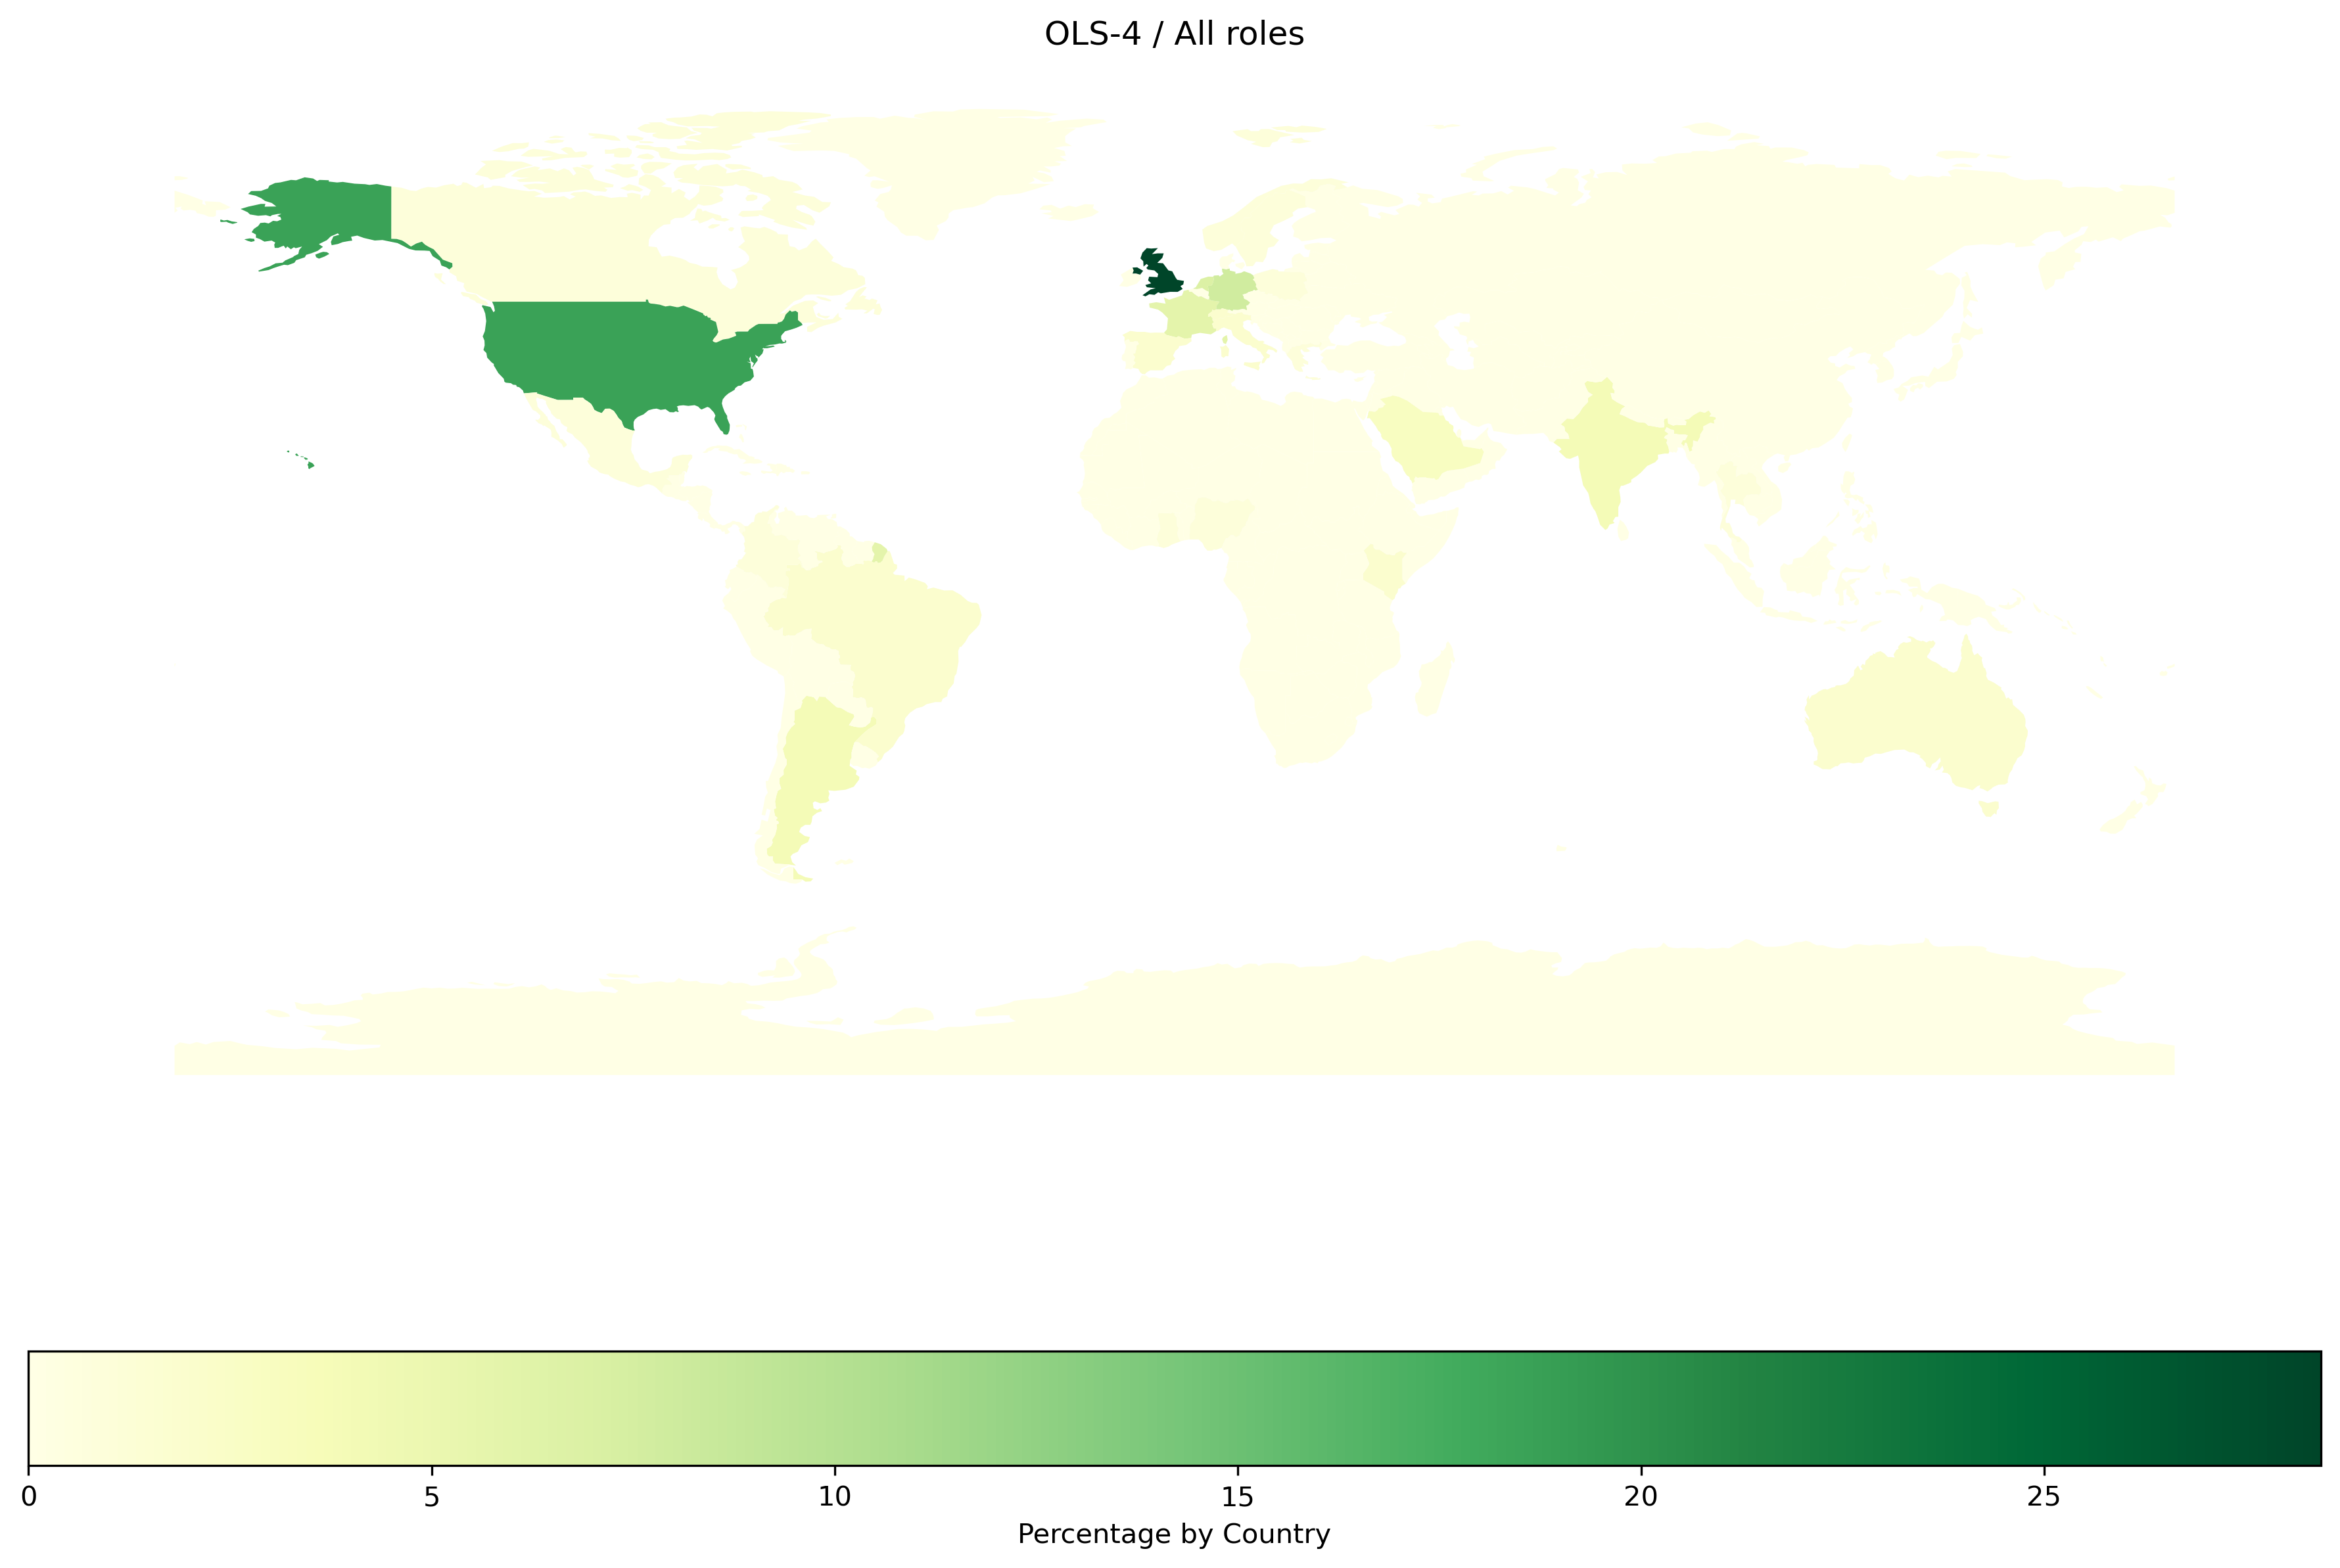
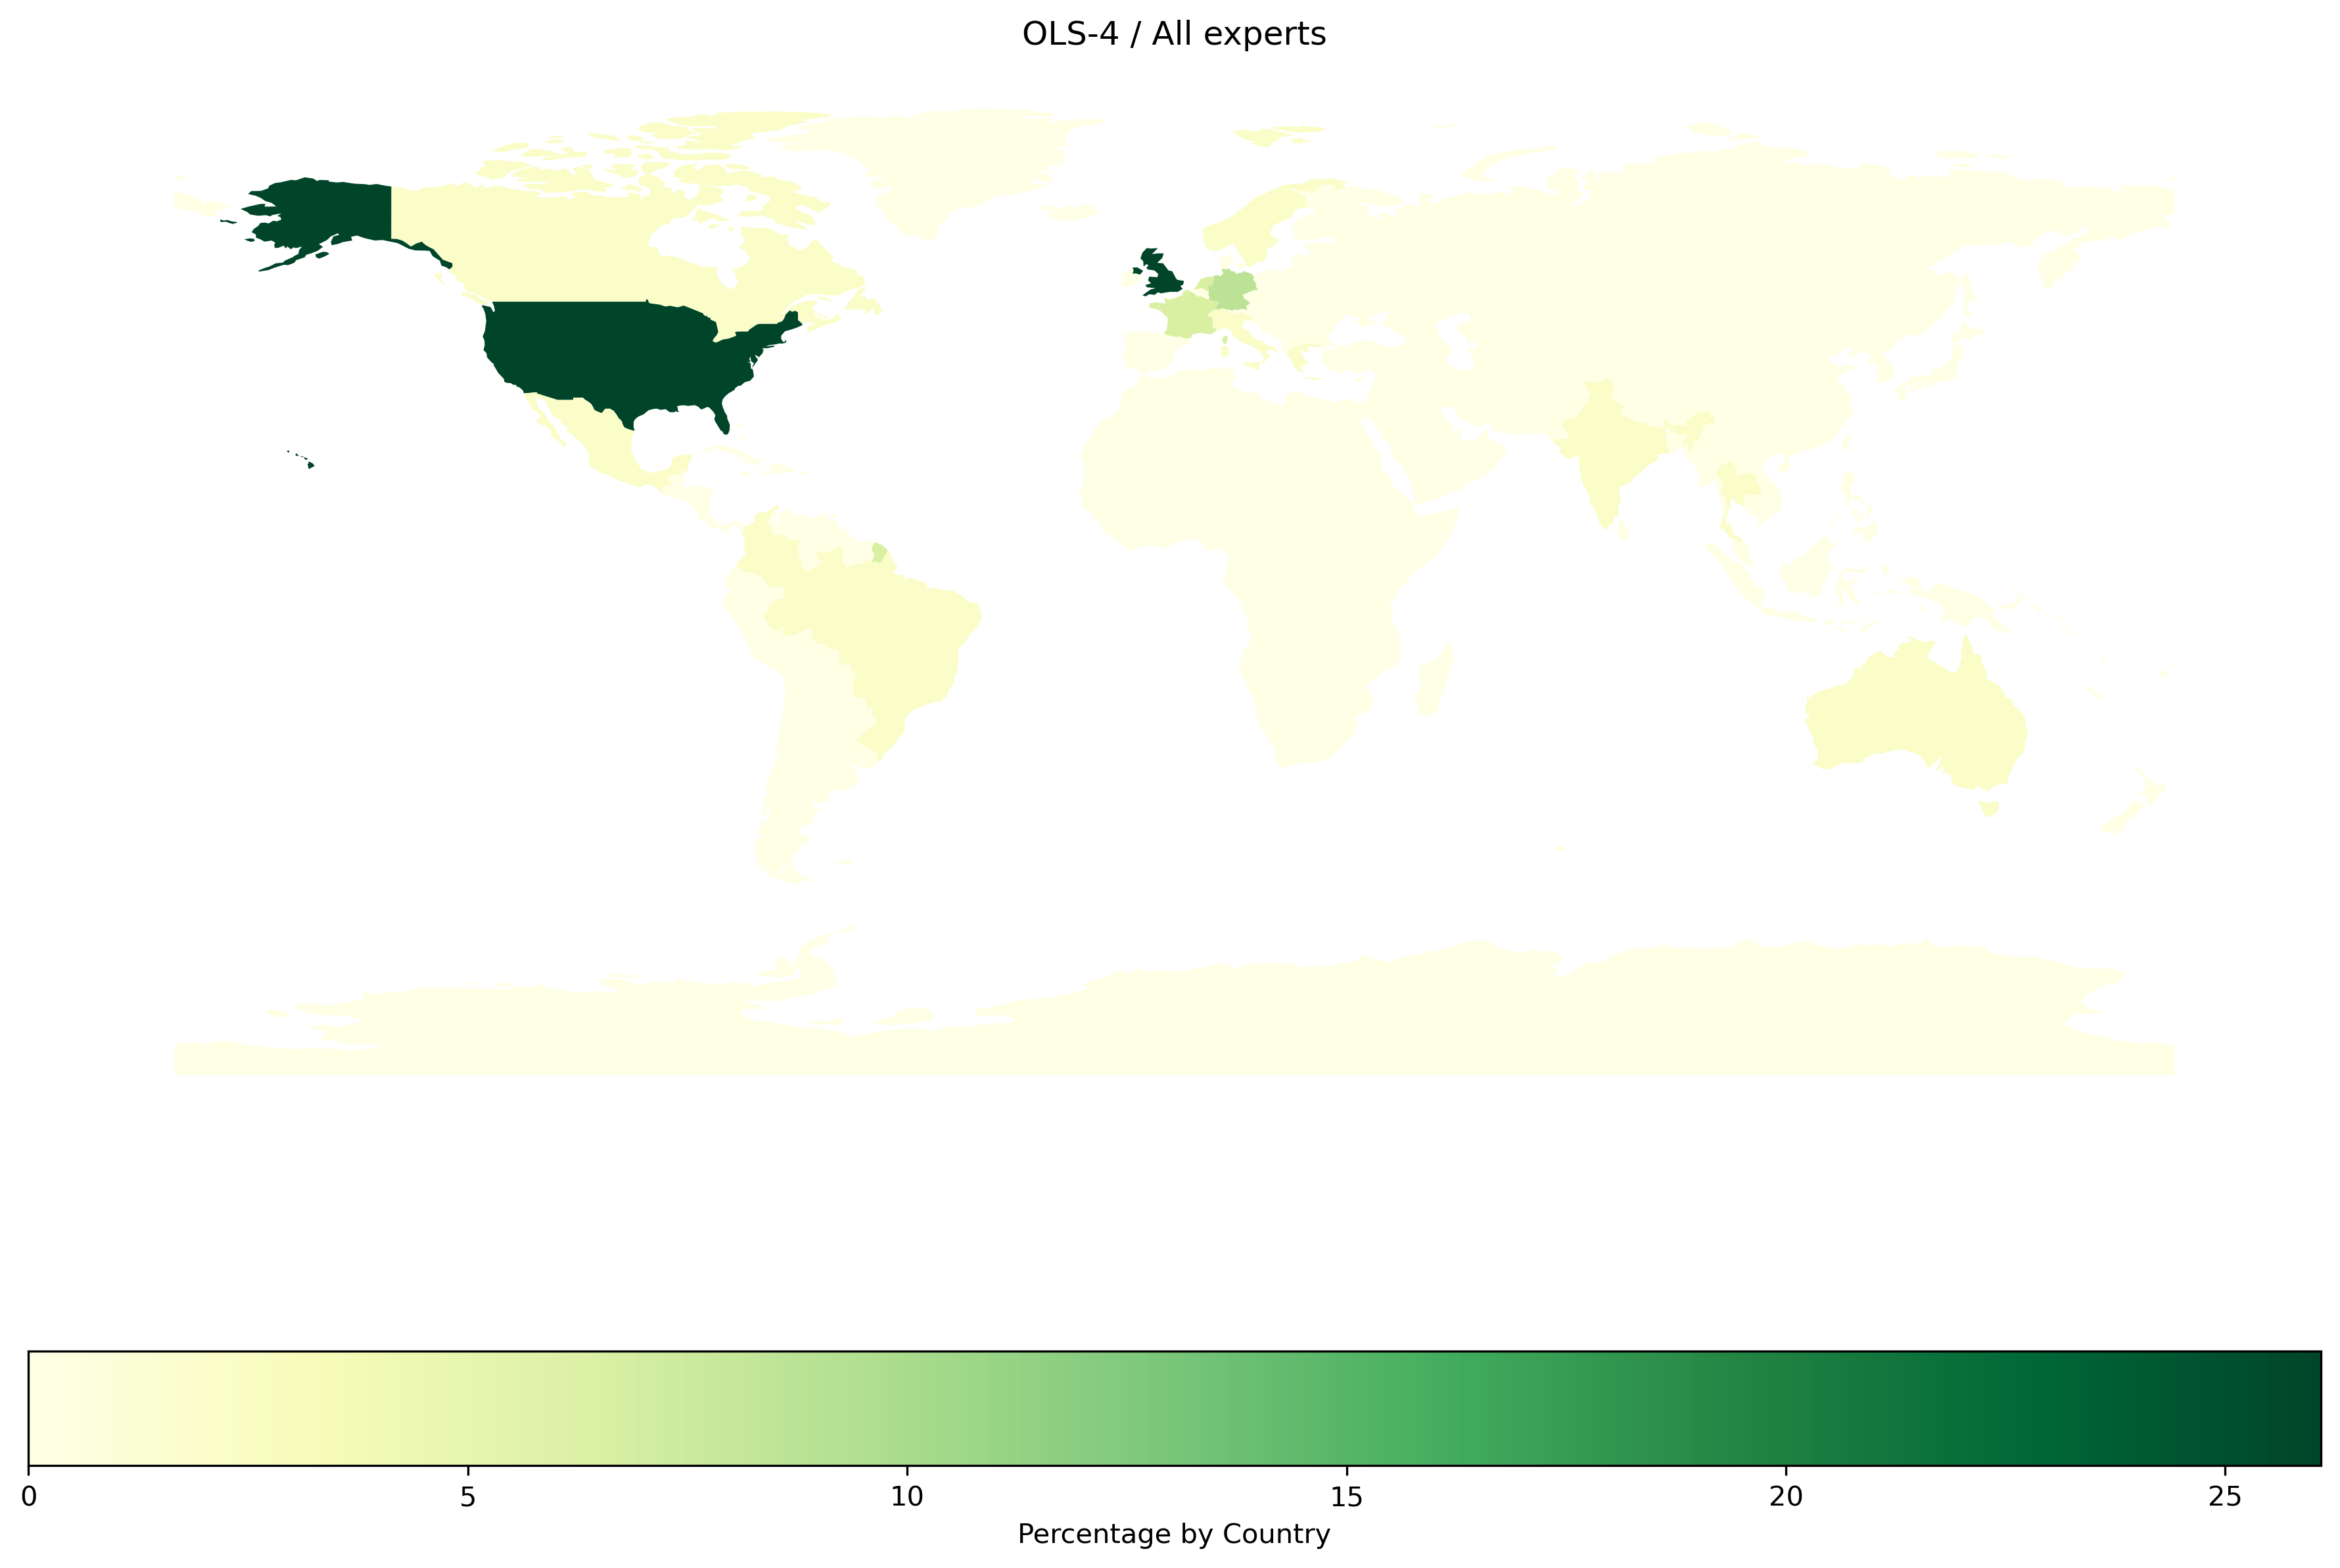
OLS-4 |
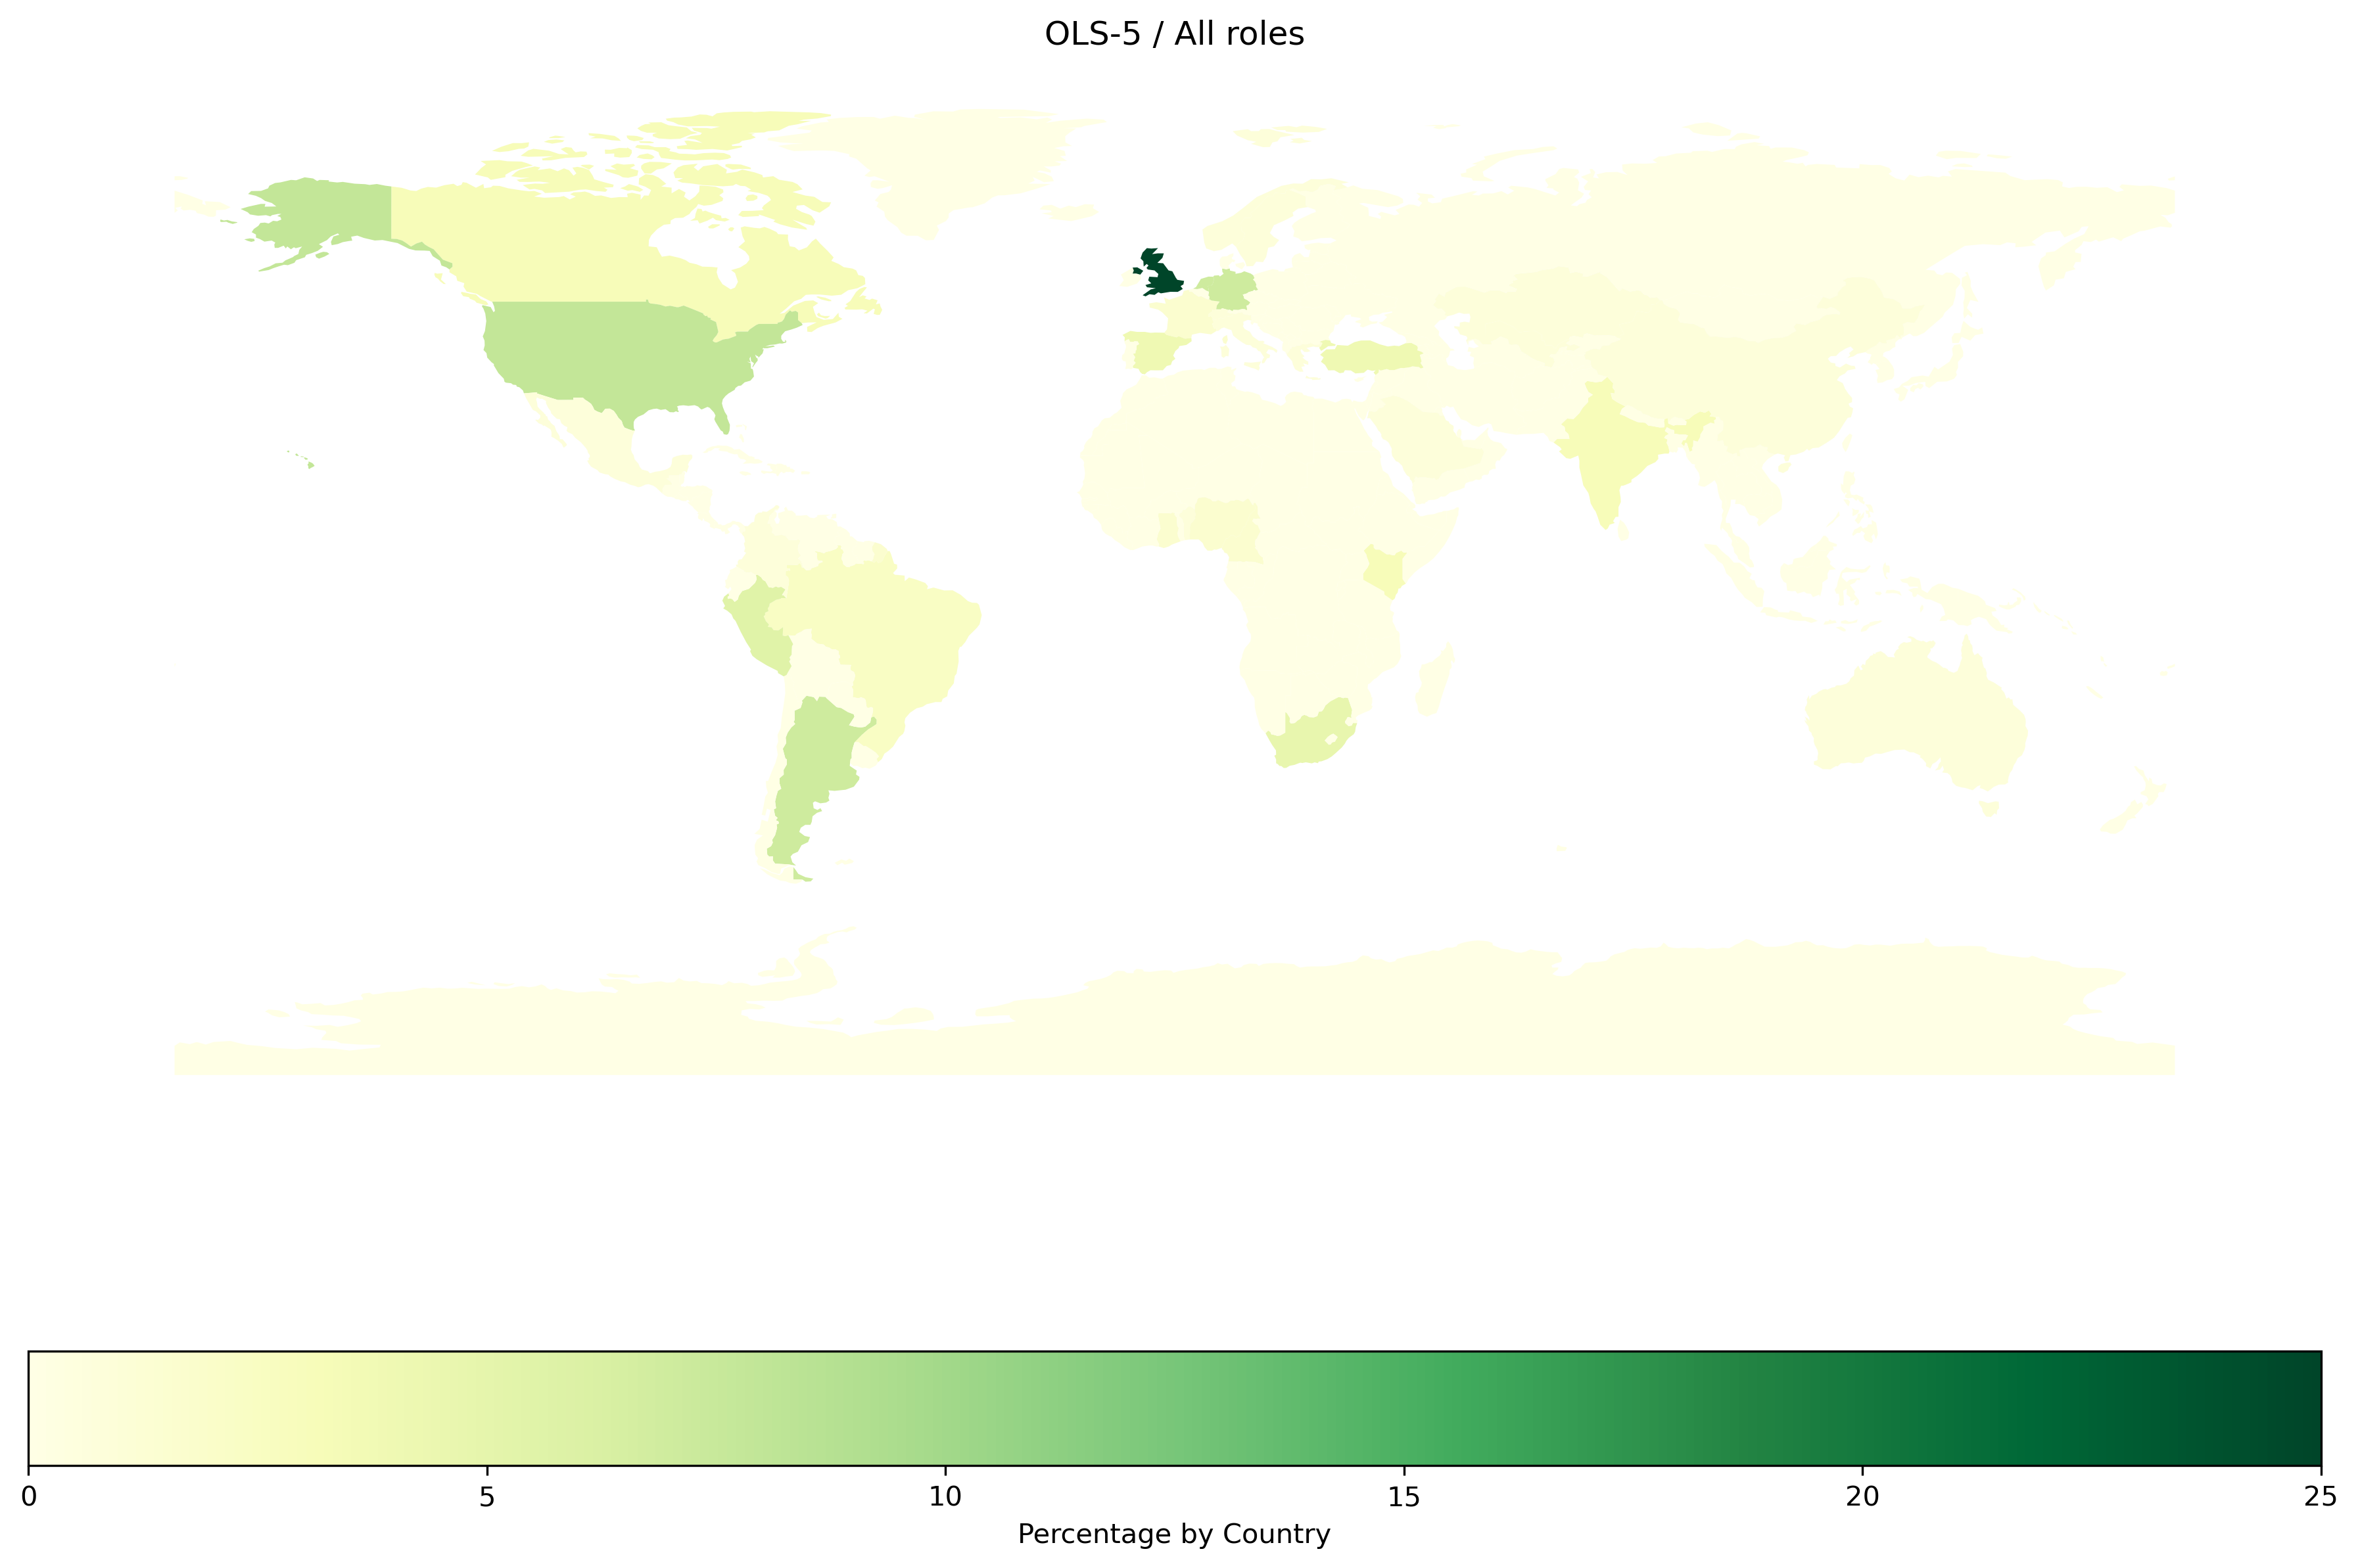
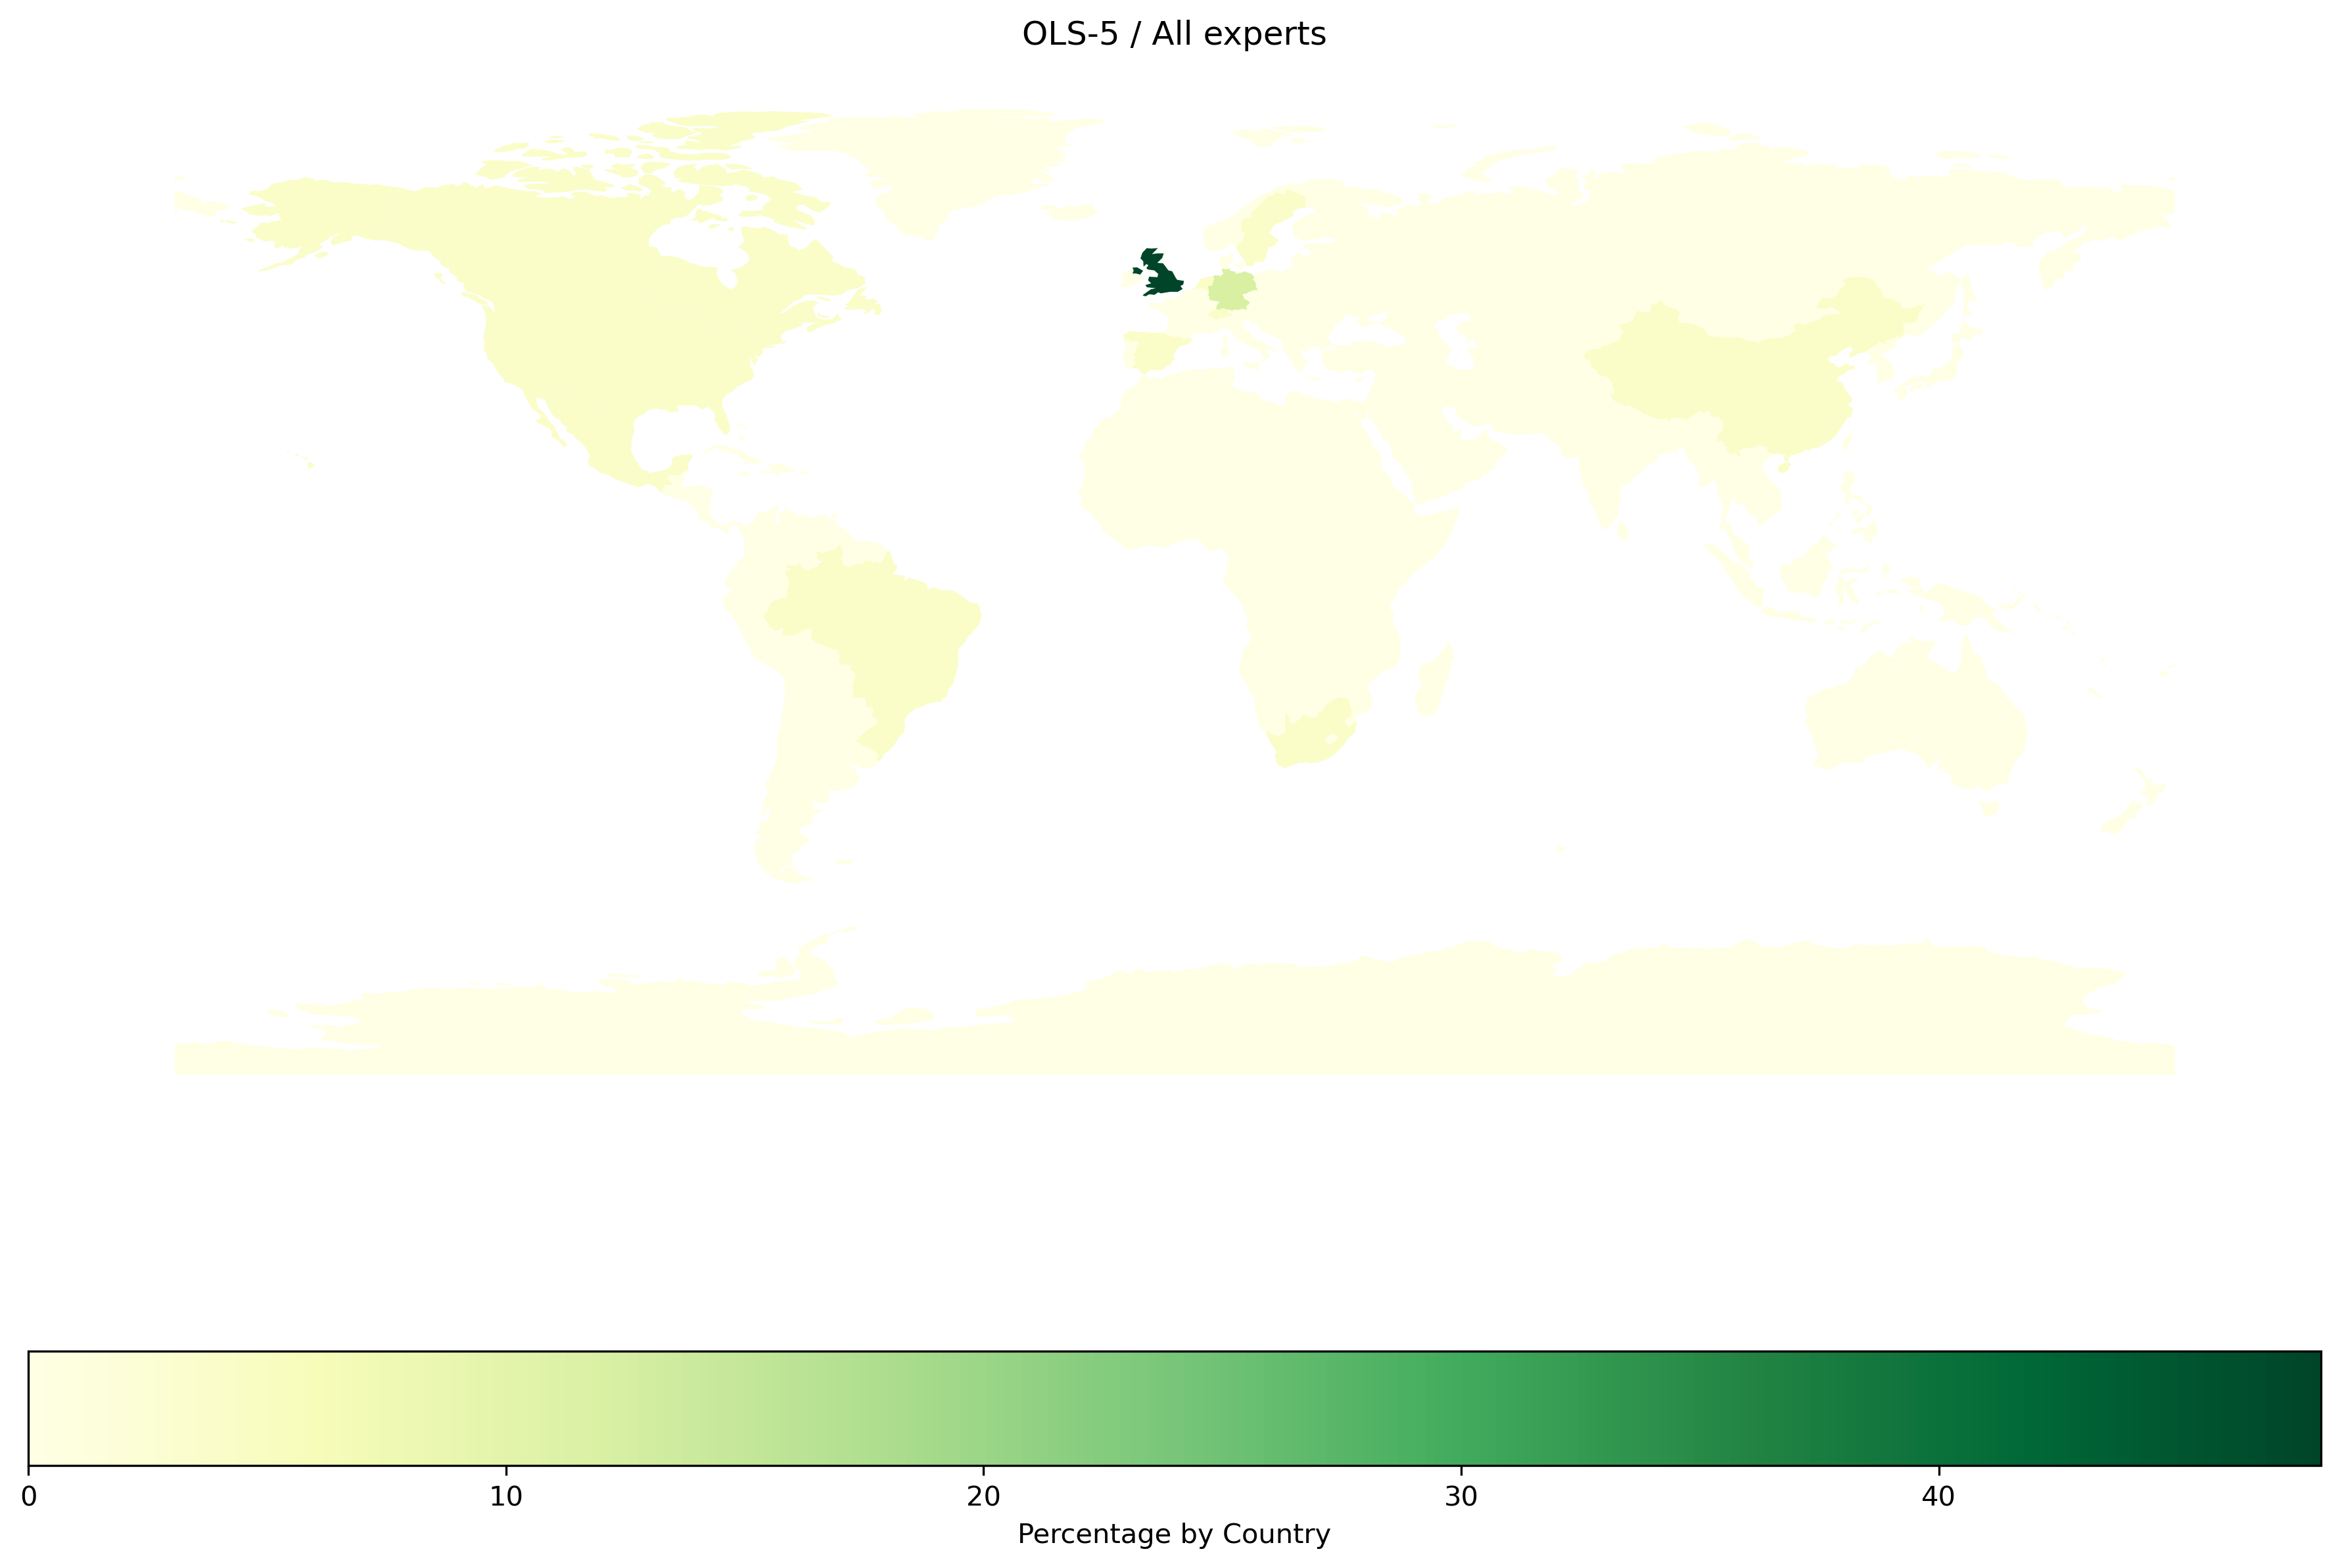
OLS-5 |
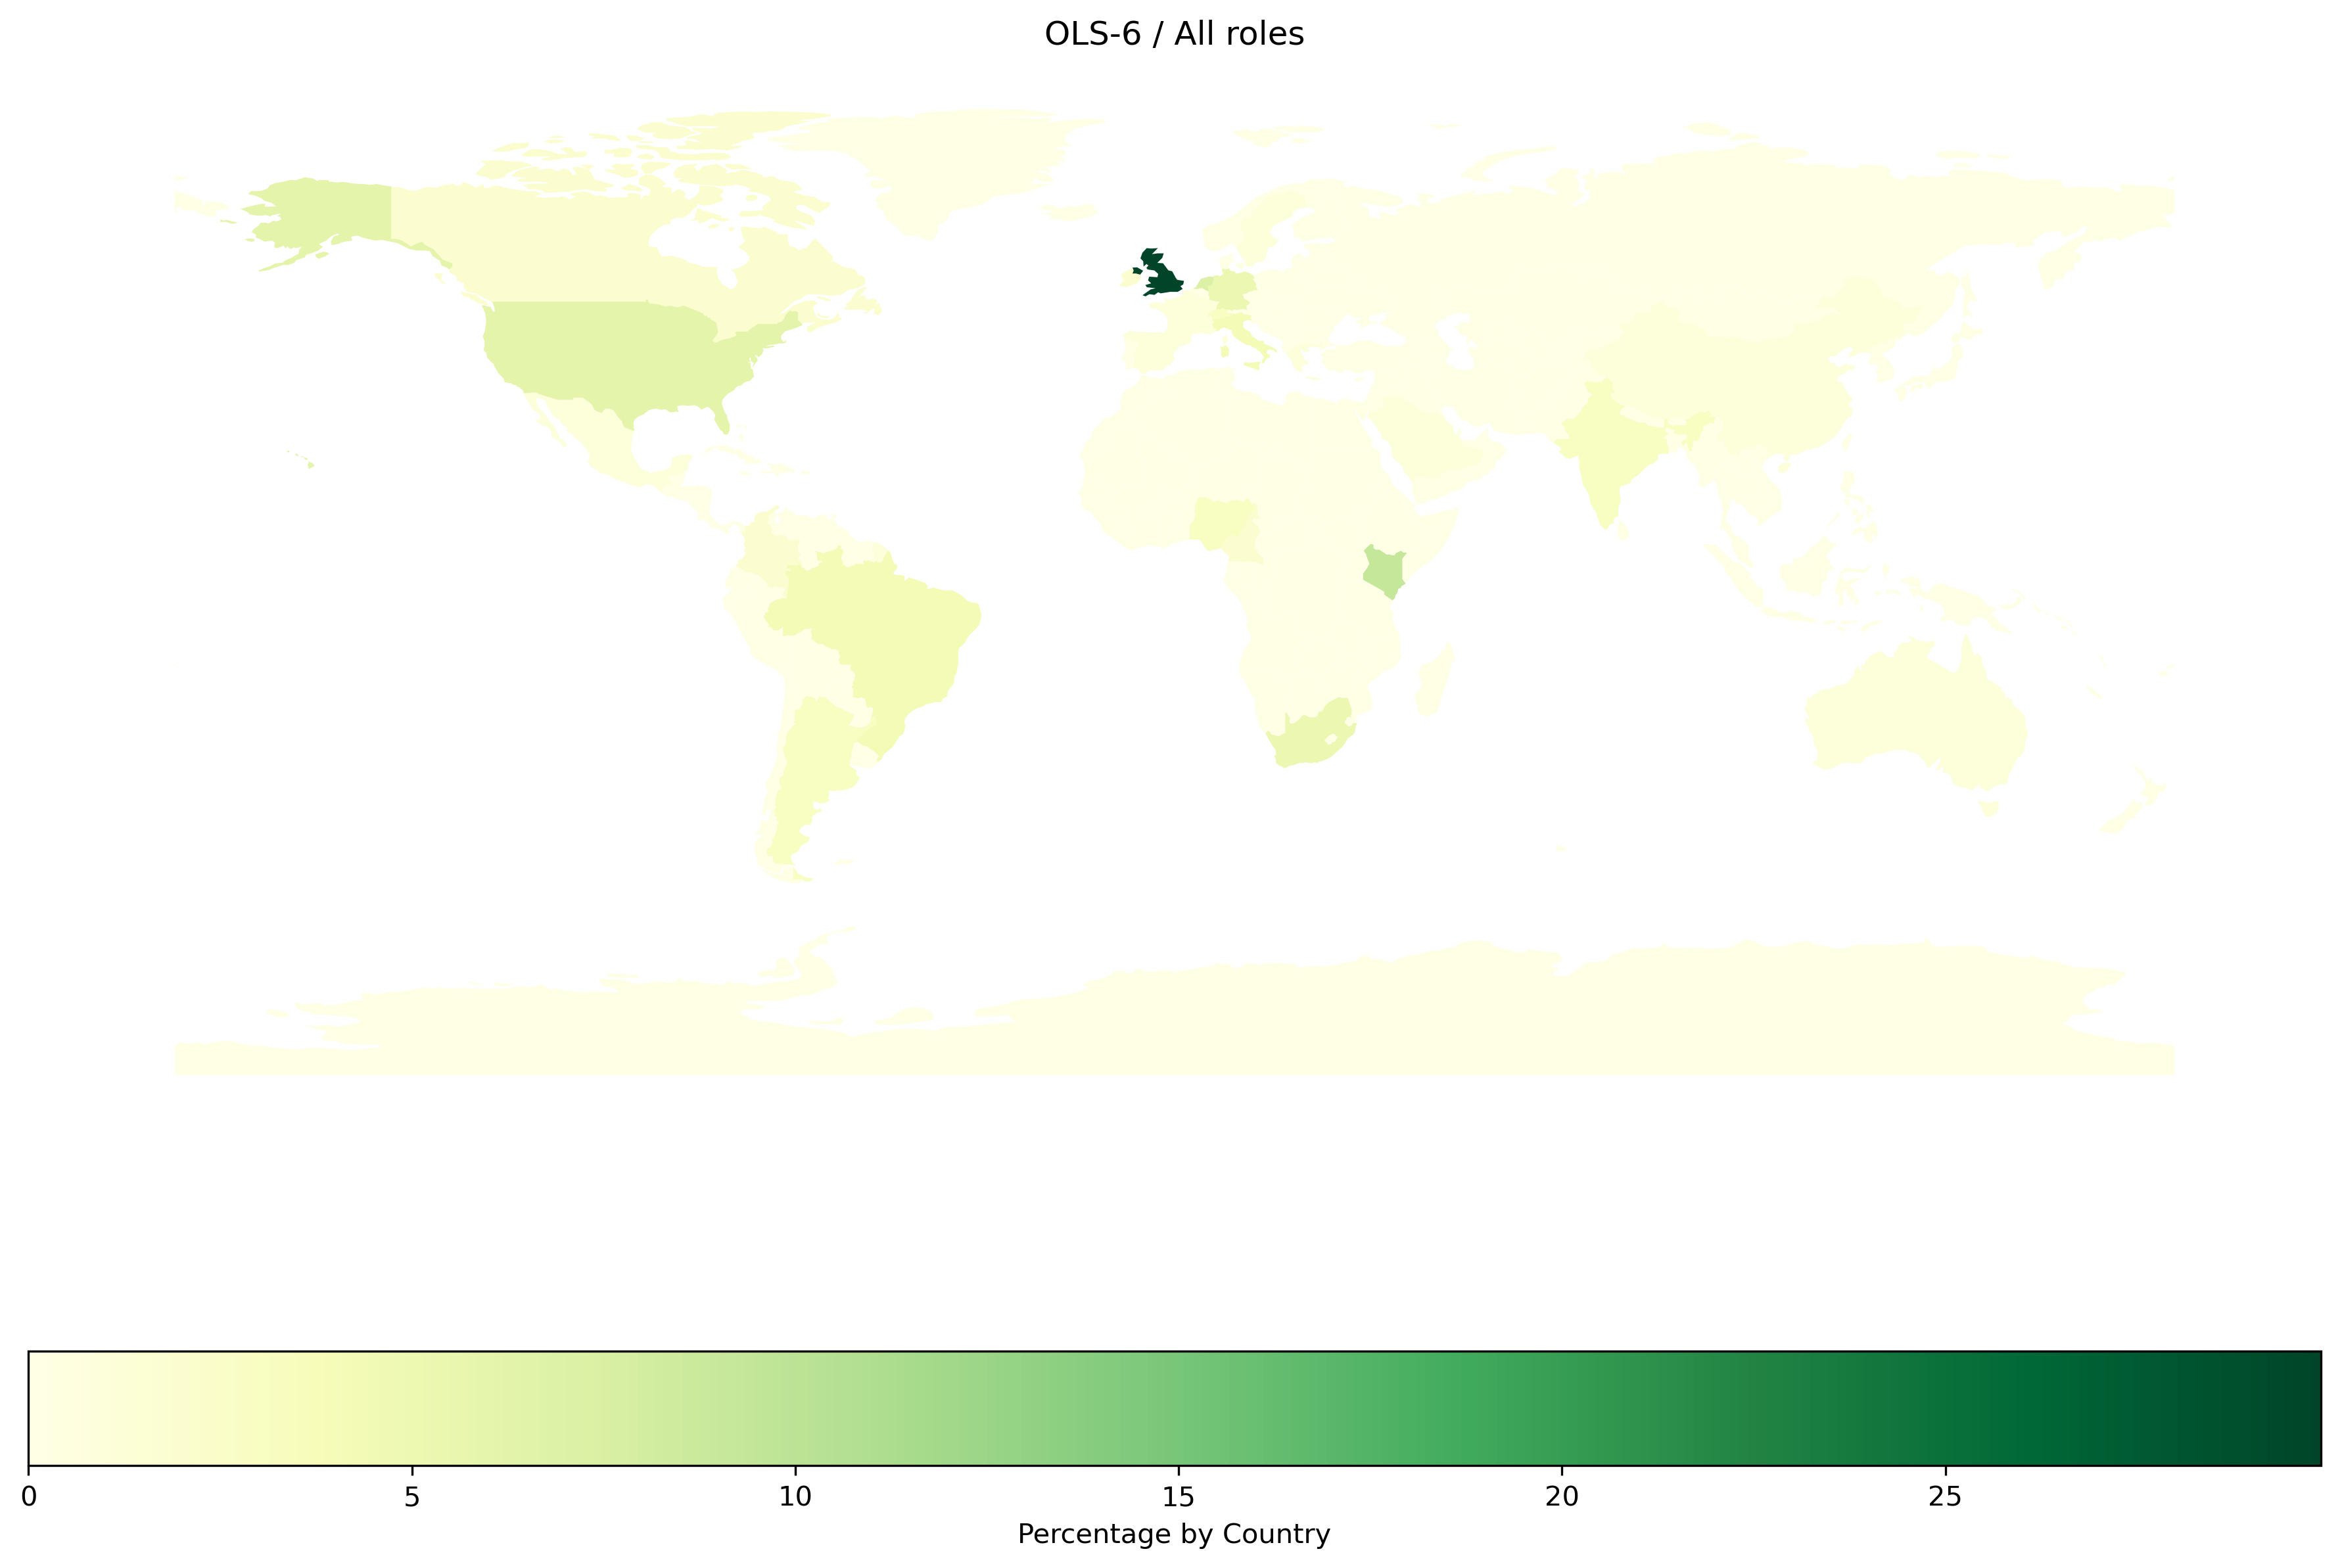
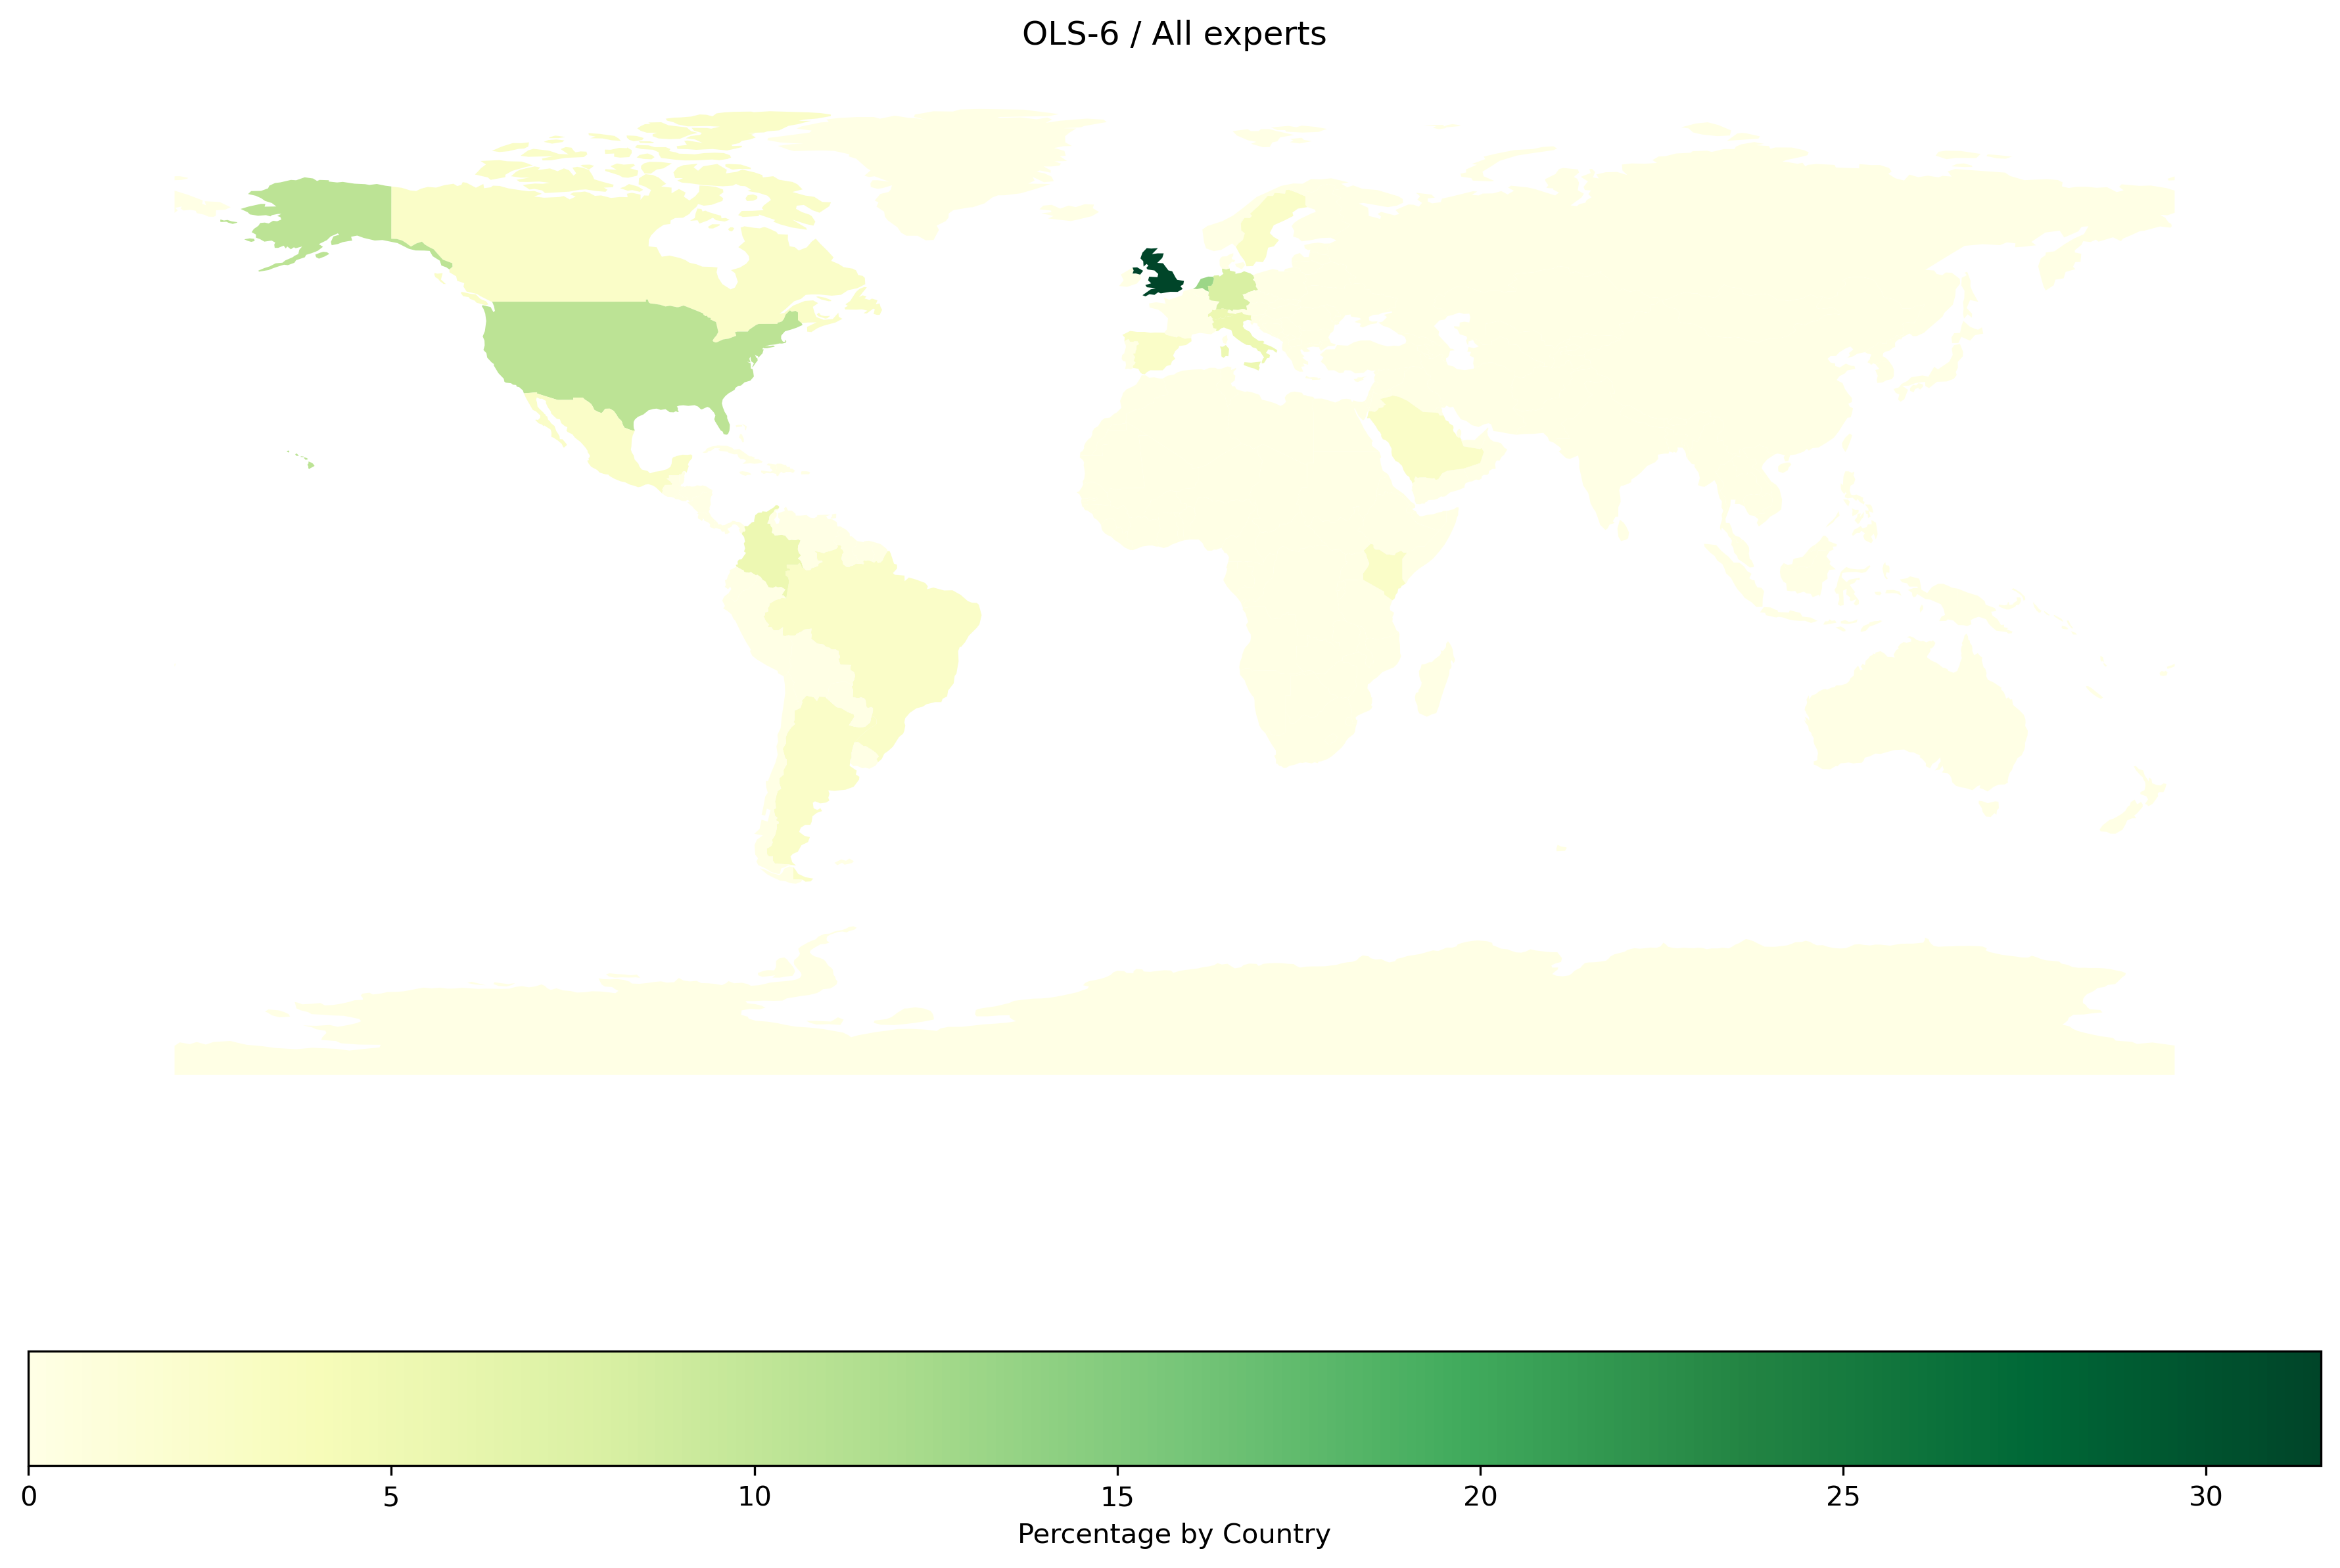
OLS-6 |
OLS-7 |
OLS-8 |
| continent |
|
|
|
|
|
|
|
|
|
| Africa |
16.536965 |
8.974359 |
13.970588 |
6.428571 |
3.921569 |
13.28125 |
19.587629 |
30.927835 |
25.757576 |
| Asia |
8.365759 |
7.692308 |
3.676471 |
13.571429 |
7.843137 |
10.15625 |
5.154639 |
2.061856 |
0.757576 |
| Europe |
48.832685 |
51.282051 |
55.882353 |
60.714286 |
58.823529 |
48.43750 |
55.670103 |
38.144330 |
47.727273 |
| North America |
12.840467 |
25.641026 |
18.382353 |
12.857143 |
20.588235 |
11.71875 |
9.278351 |
8.247423 |
4.545455 |
| Oceania |
1.750973 |
1.282051 |
3.676471 |
2.857143 |
1.960784 |
0.78125 |
1.030928 |
2.061856 |
0.000000 |
| South America |
11.673152 |
5.128205 |
4.411765 |
3.571429 |
6.862745 |
15.62500 |
9.278351 |
18.556701 |
21.212121 |
|
Participant |
Mentor |
Speaker |
Expert |
Facilitator |
total |
| continent |
|
|
|
|
|
|
| Africa |
20.348059 |
13.486005 |
9.049774 |
5.341880 |
46.666667 |
14.968487 |
| Asia |
10.843373 |
4.325700 |
4.072398 |
3.418803 |
5.333333 |
6.670168 |
| Europe |
43.373494 |
56.997455 |
59.276018 |
64.529915 |
32.000000 |
52.783613 |
| North America |
11.111111 |
11.450382 |
15.384615 |
17.094017 |
5.333333 |
12.920168 |
| Oceania |
0.803213 |
2.290076 |
4.072398 |
2.777778 |
0.000000 |
1.943277 |
| South America |
13.520750 |
11.450382 |
8.144796 |
6.837607 |
10.666667 |
10.714286 |
<matplotlib.legend.Legend at 0x7f6f9974bf10>
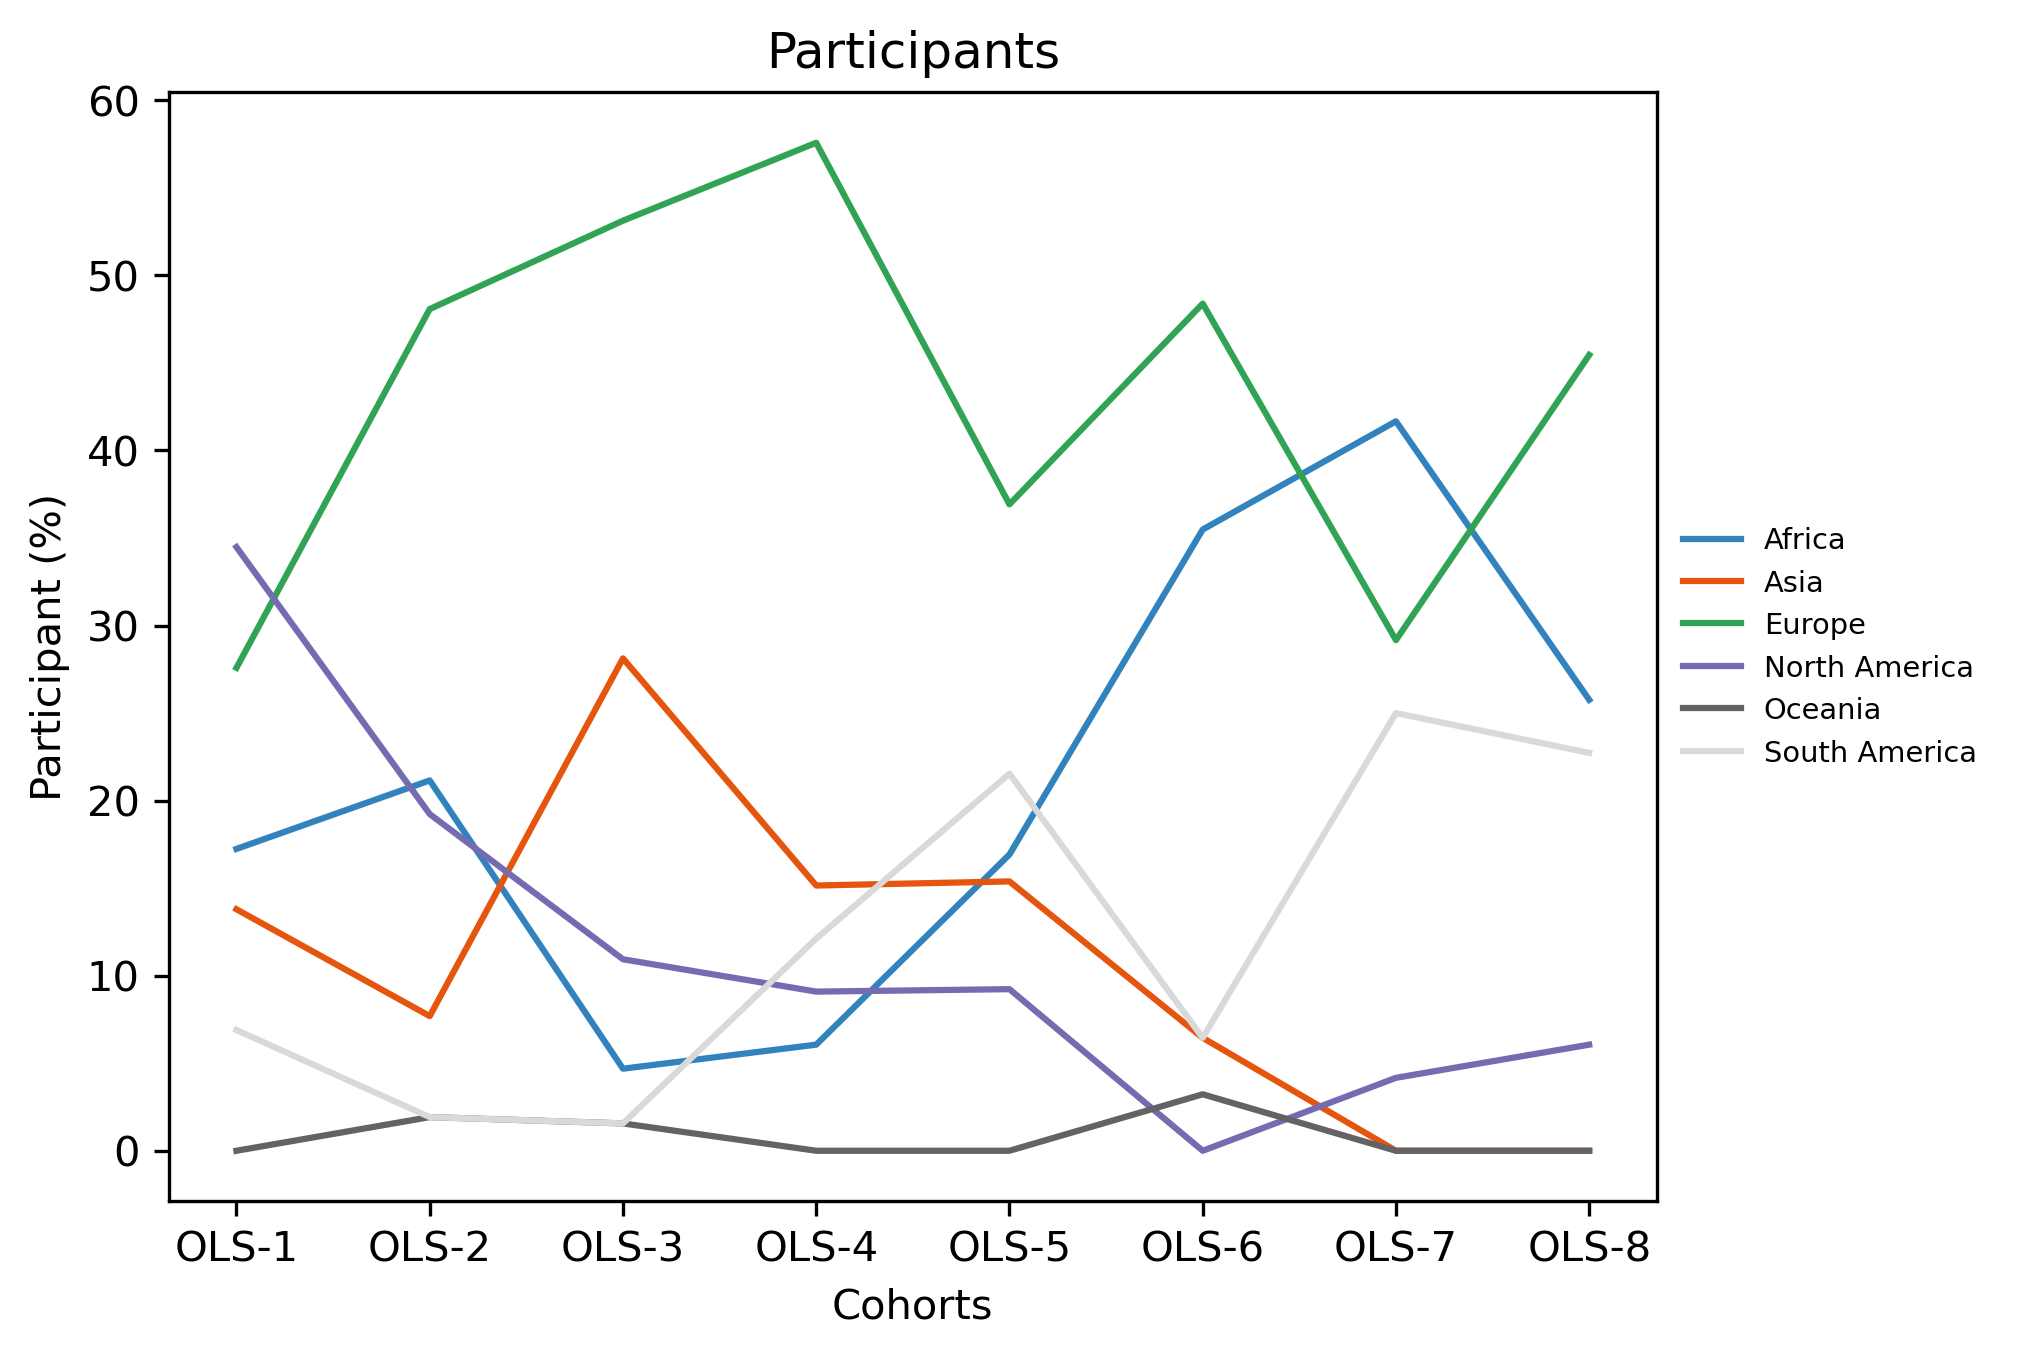
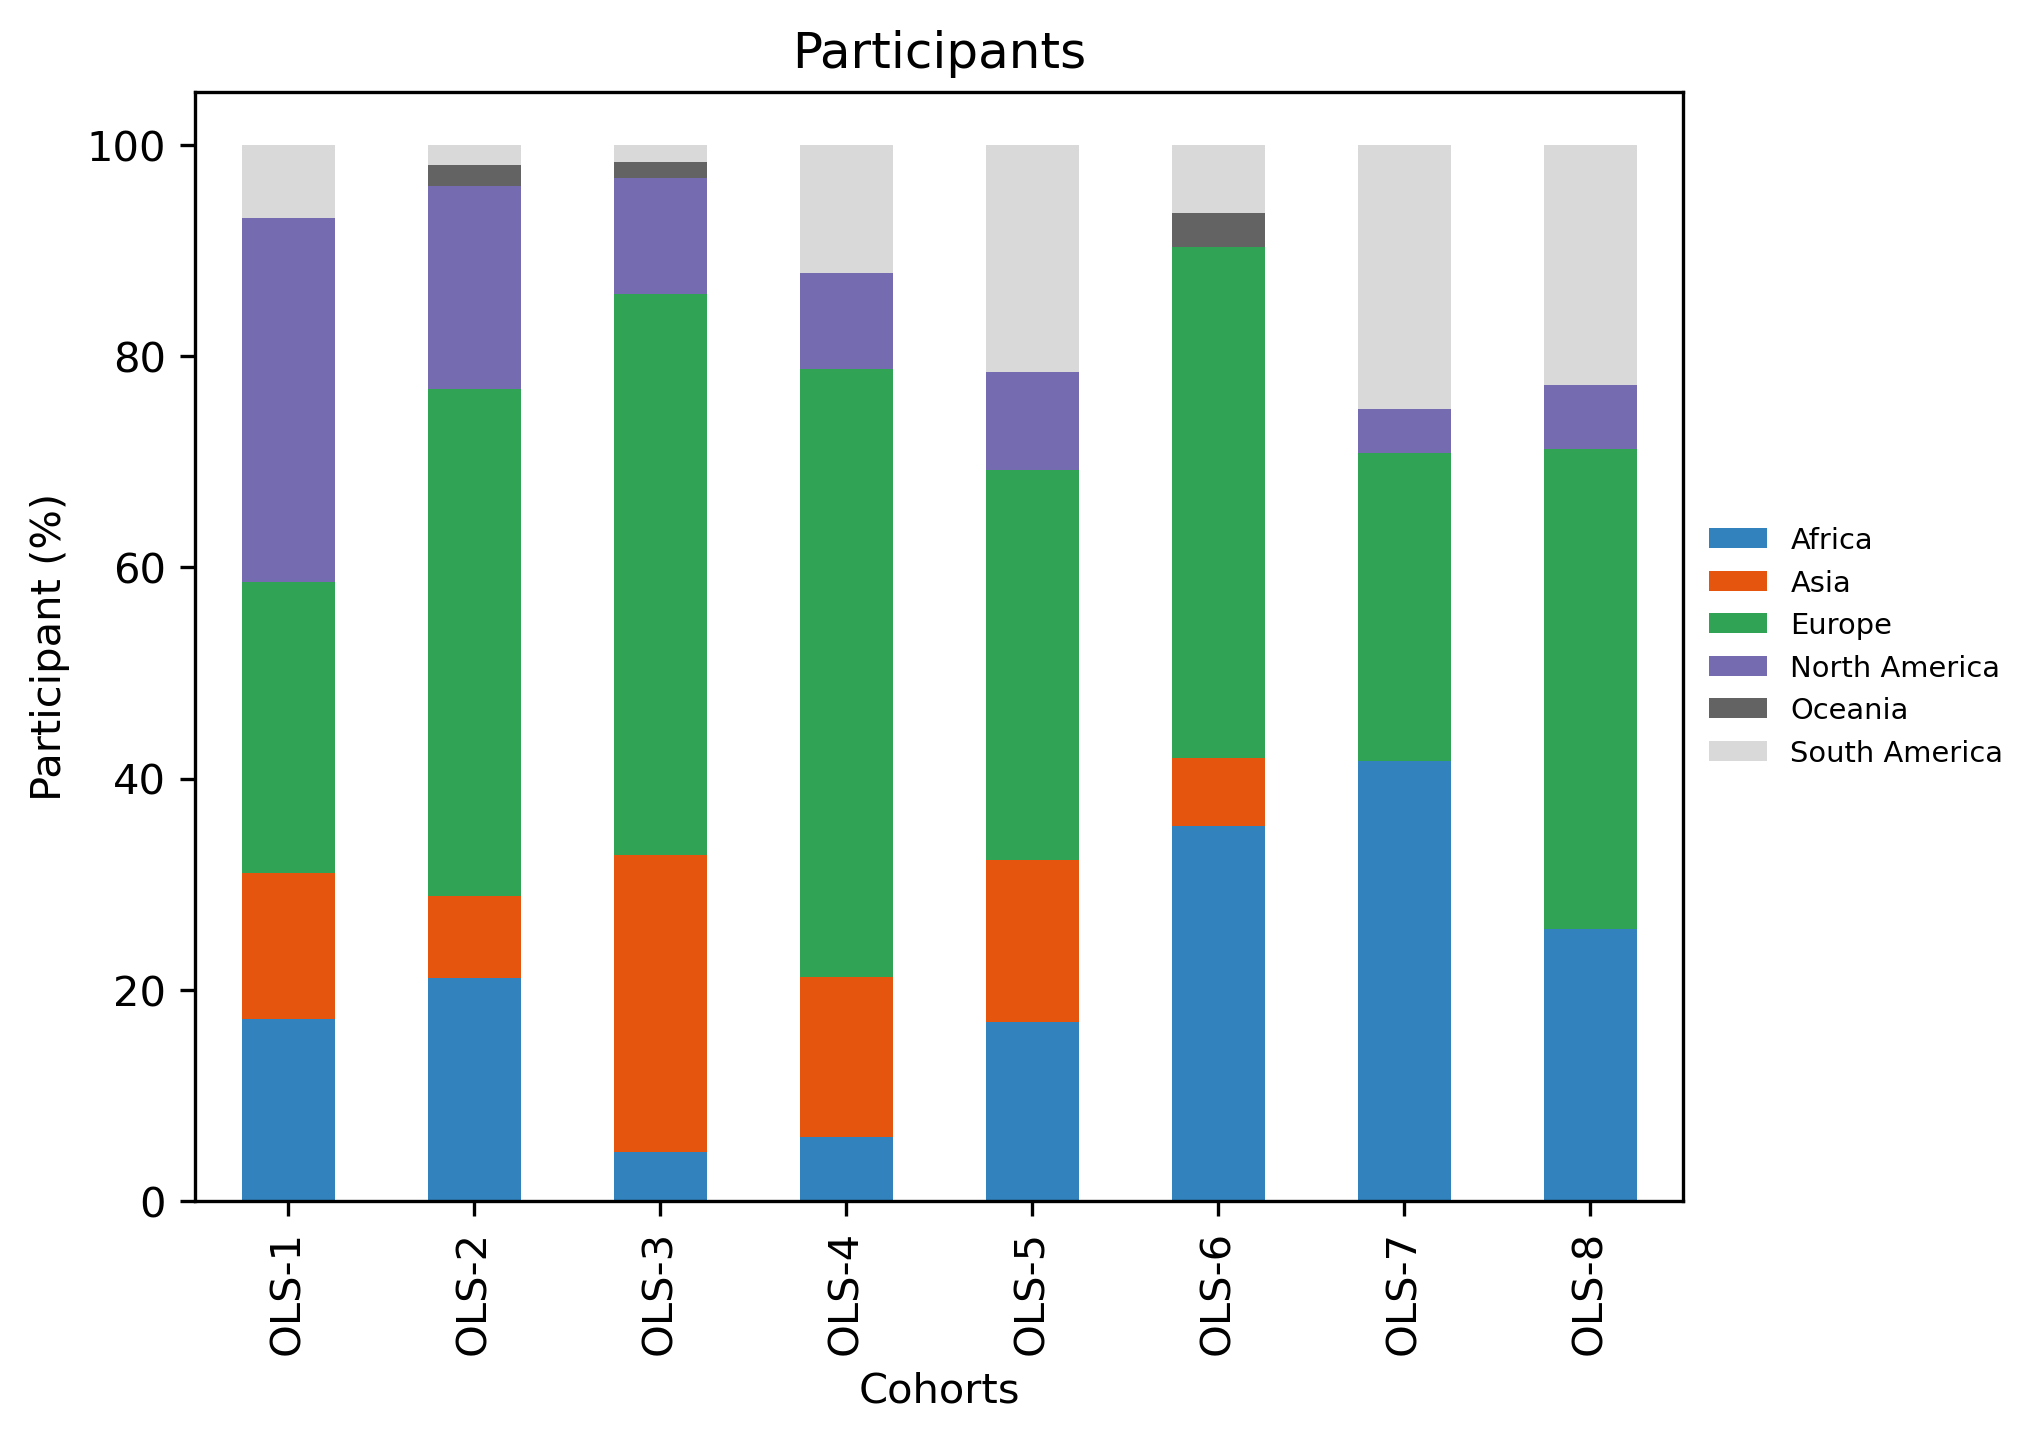
Participants
|
TOTAL |
OLS-1 |
OLS-2 |
OLS-3 |
OLS-4 |
OLS-5 |
OLS-6 |
OLS-7 |
OLS-8 |
| continent |
|
|
|
|
|
|
|
|
|
| Africa |
20.055710 |
17.241379 |
21.153846 |
4.6875 |
6.060606 |
16.923077 |
35.483871 |
41.666667 |
25.757576 |
| Asia |
10.584958 |
13.793103 |
7.692308 |
28.1250 |
15.151515 |
15.384615 |
6.451613 |
0.000000 |
0.000000 |
| Europe |
43.175487 |
27.586207 |
48.076923 |
53.1250 |
57.575758 |
36.923077 |
48.387097 |
29.166667 |
45.454545 |
| North America |
11.420613 |
34.482759 |
19.230769 |
10.9375 |
9.090909 |
9.230769 |
0.000000 |
4.166667 |
6.060606 |
| Oceania |
0.835655 |
0.000000 |
1.923077 |
1.5625 |
0.000000 |
0.000000 |
3.225806 |
0.000000 |
0.000000 |
| South America |
13.927577 |
6.896552 |
1.923077 |
1.5625 |
12.121212 |
21.538462 |
6.451613 |
25.000000 |
22.727273 |
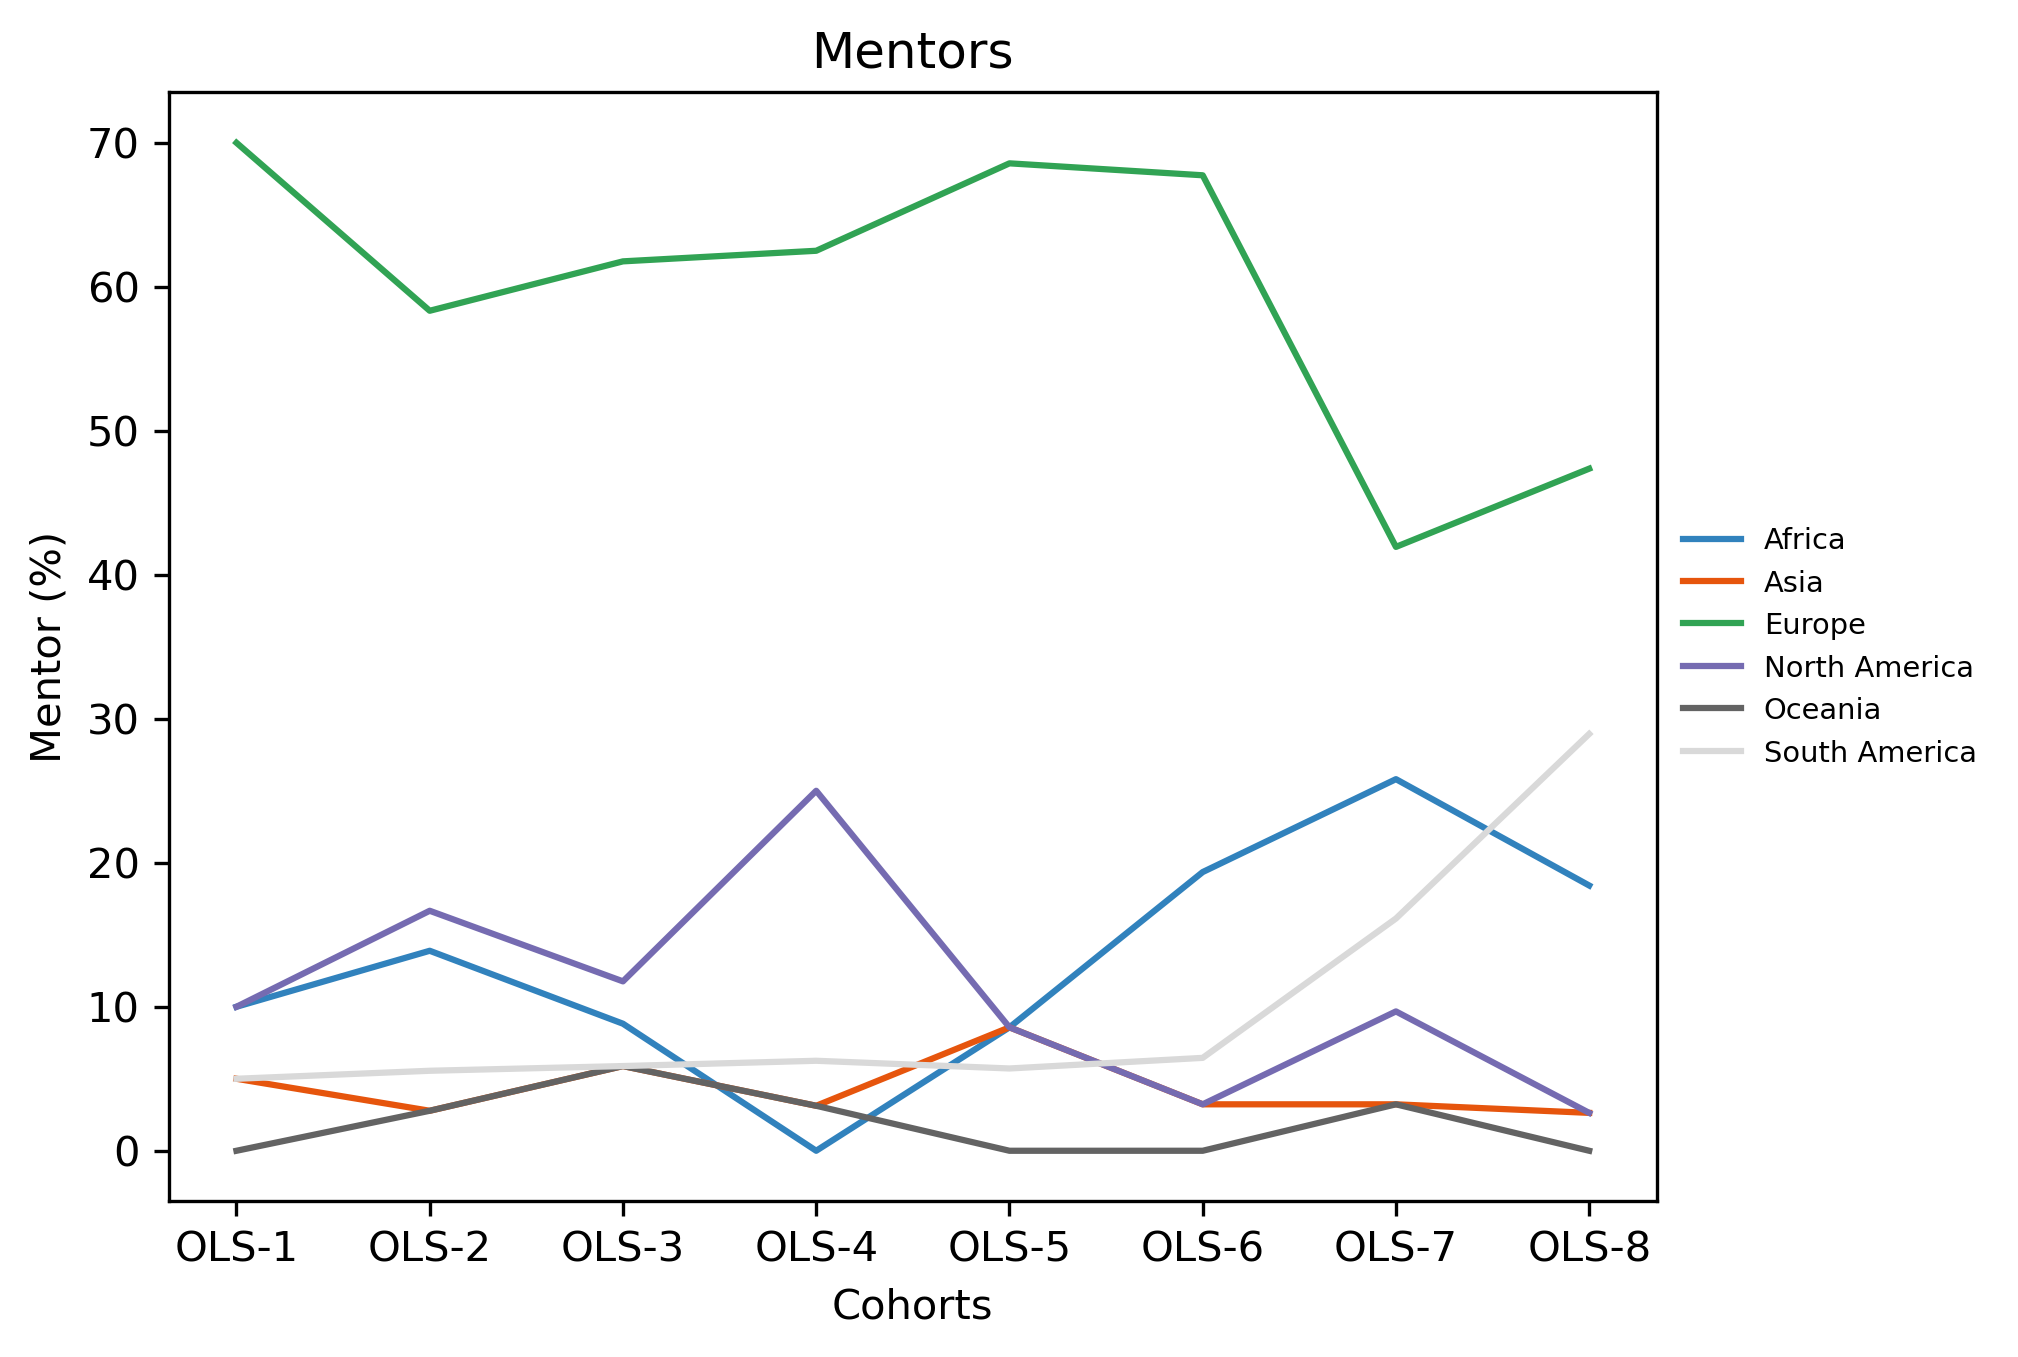
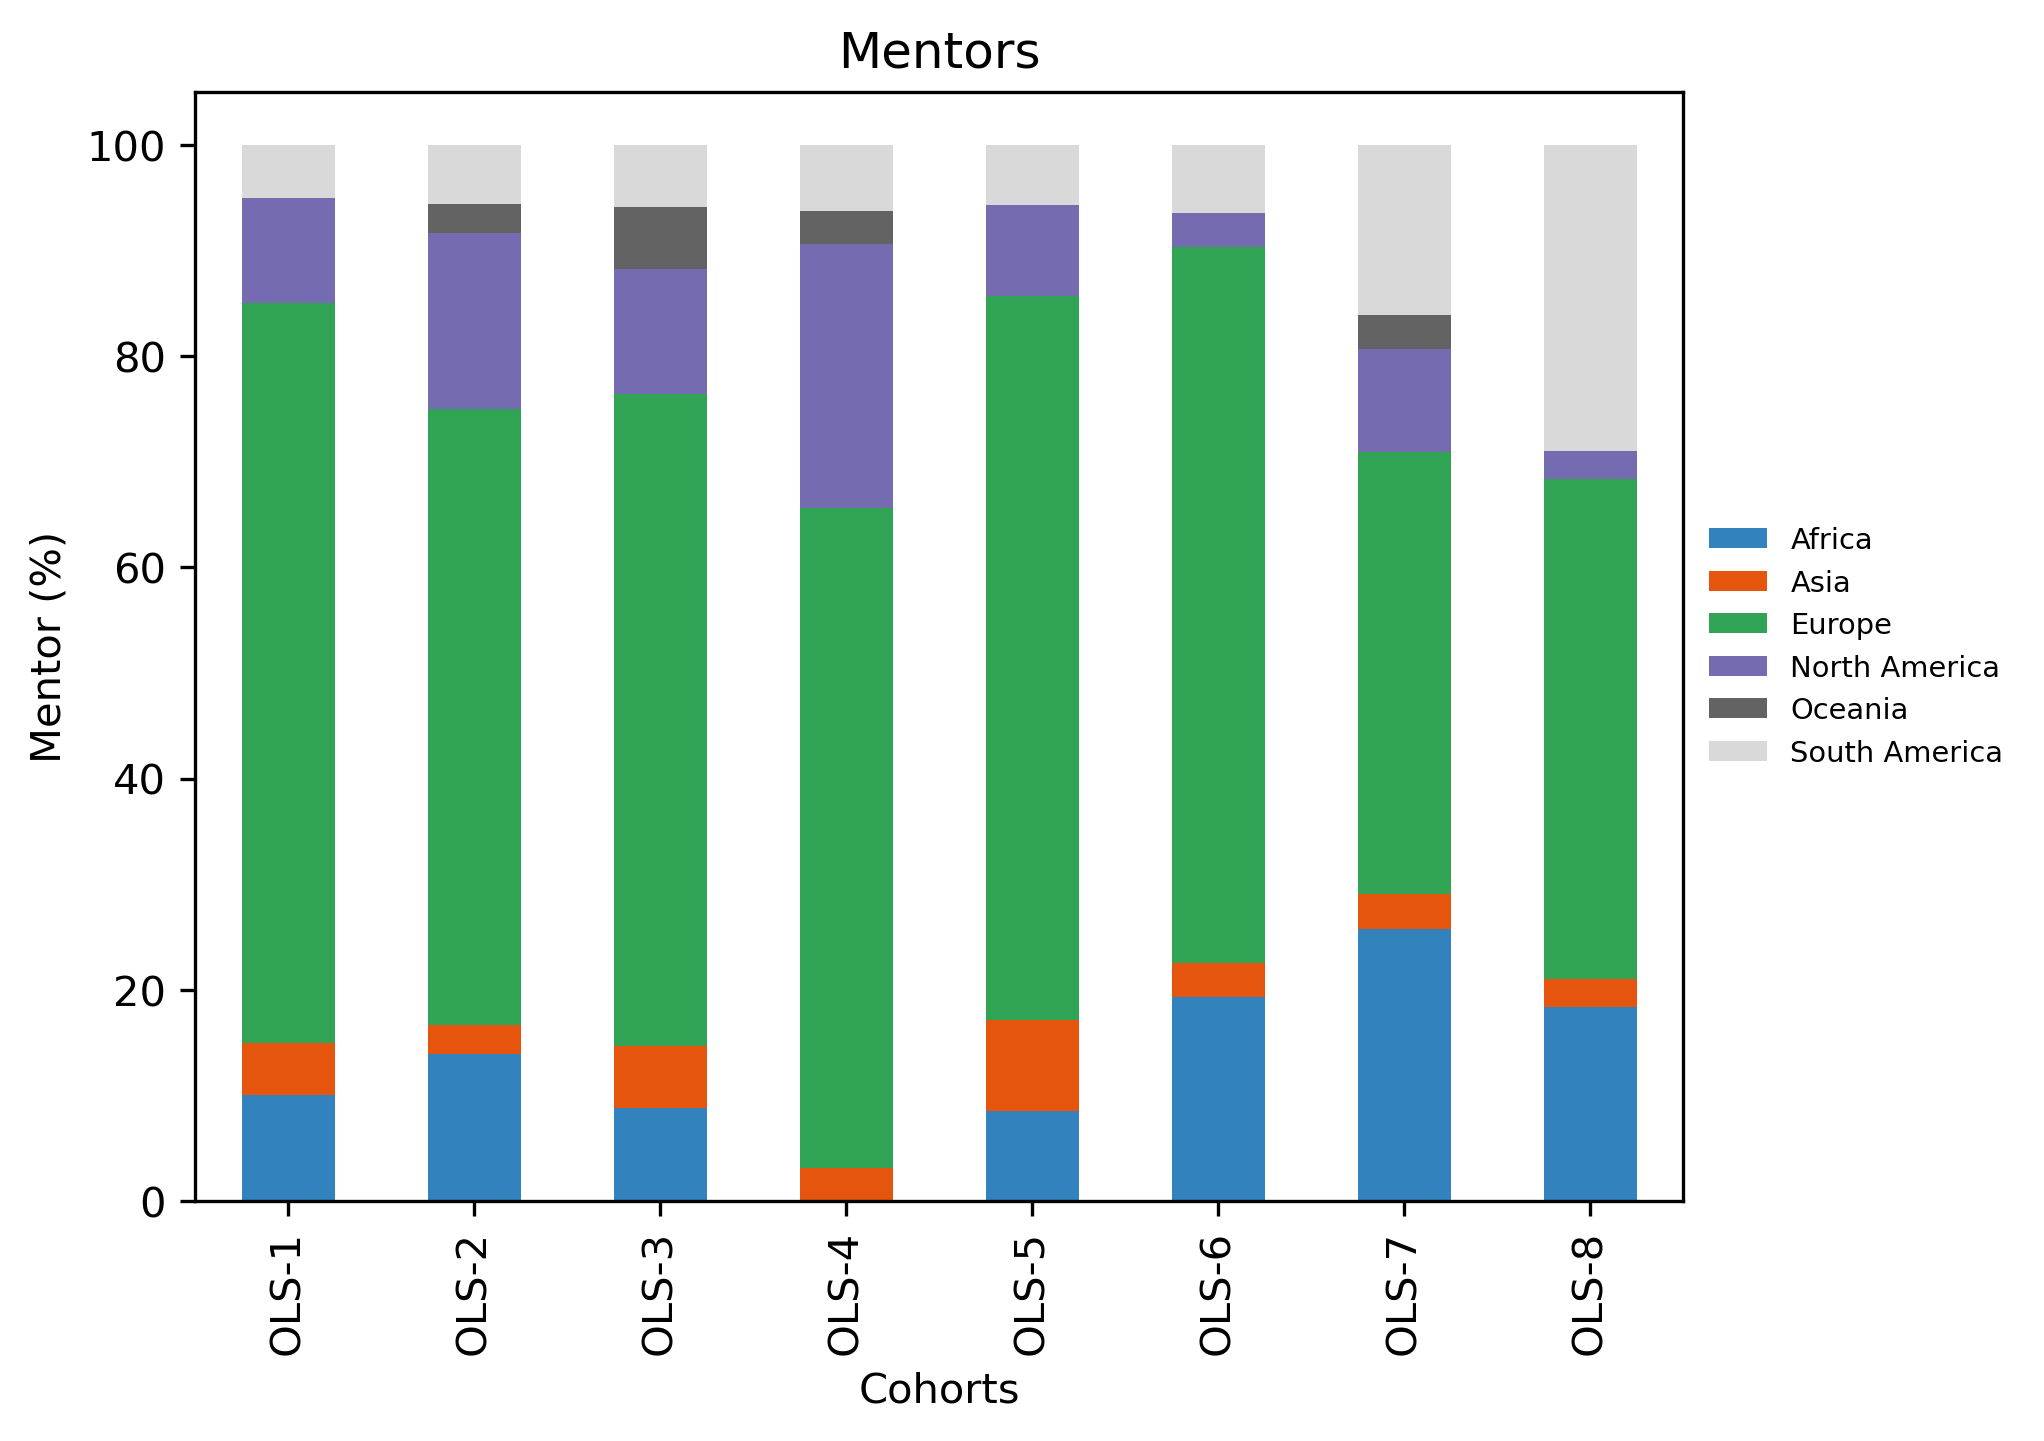
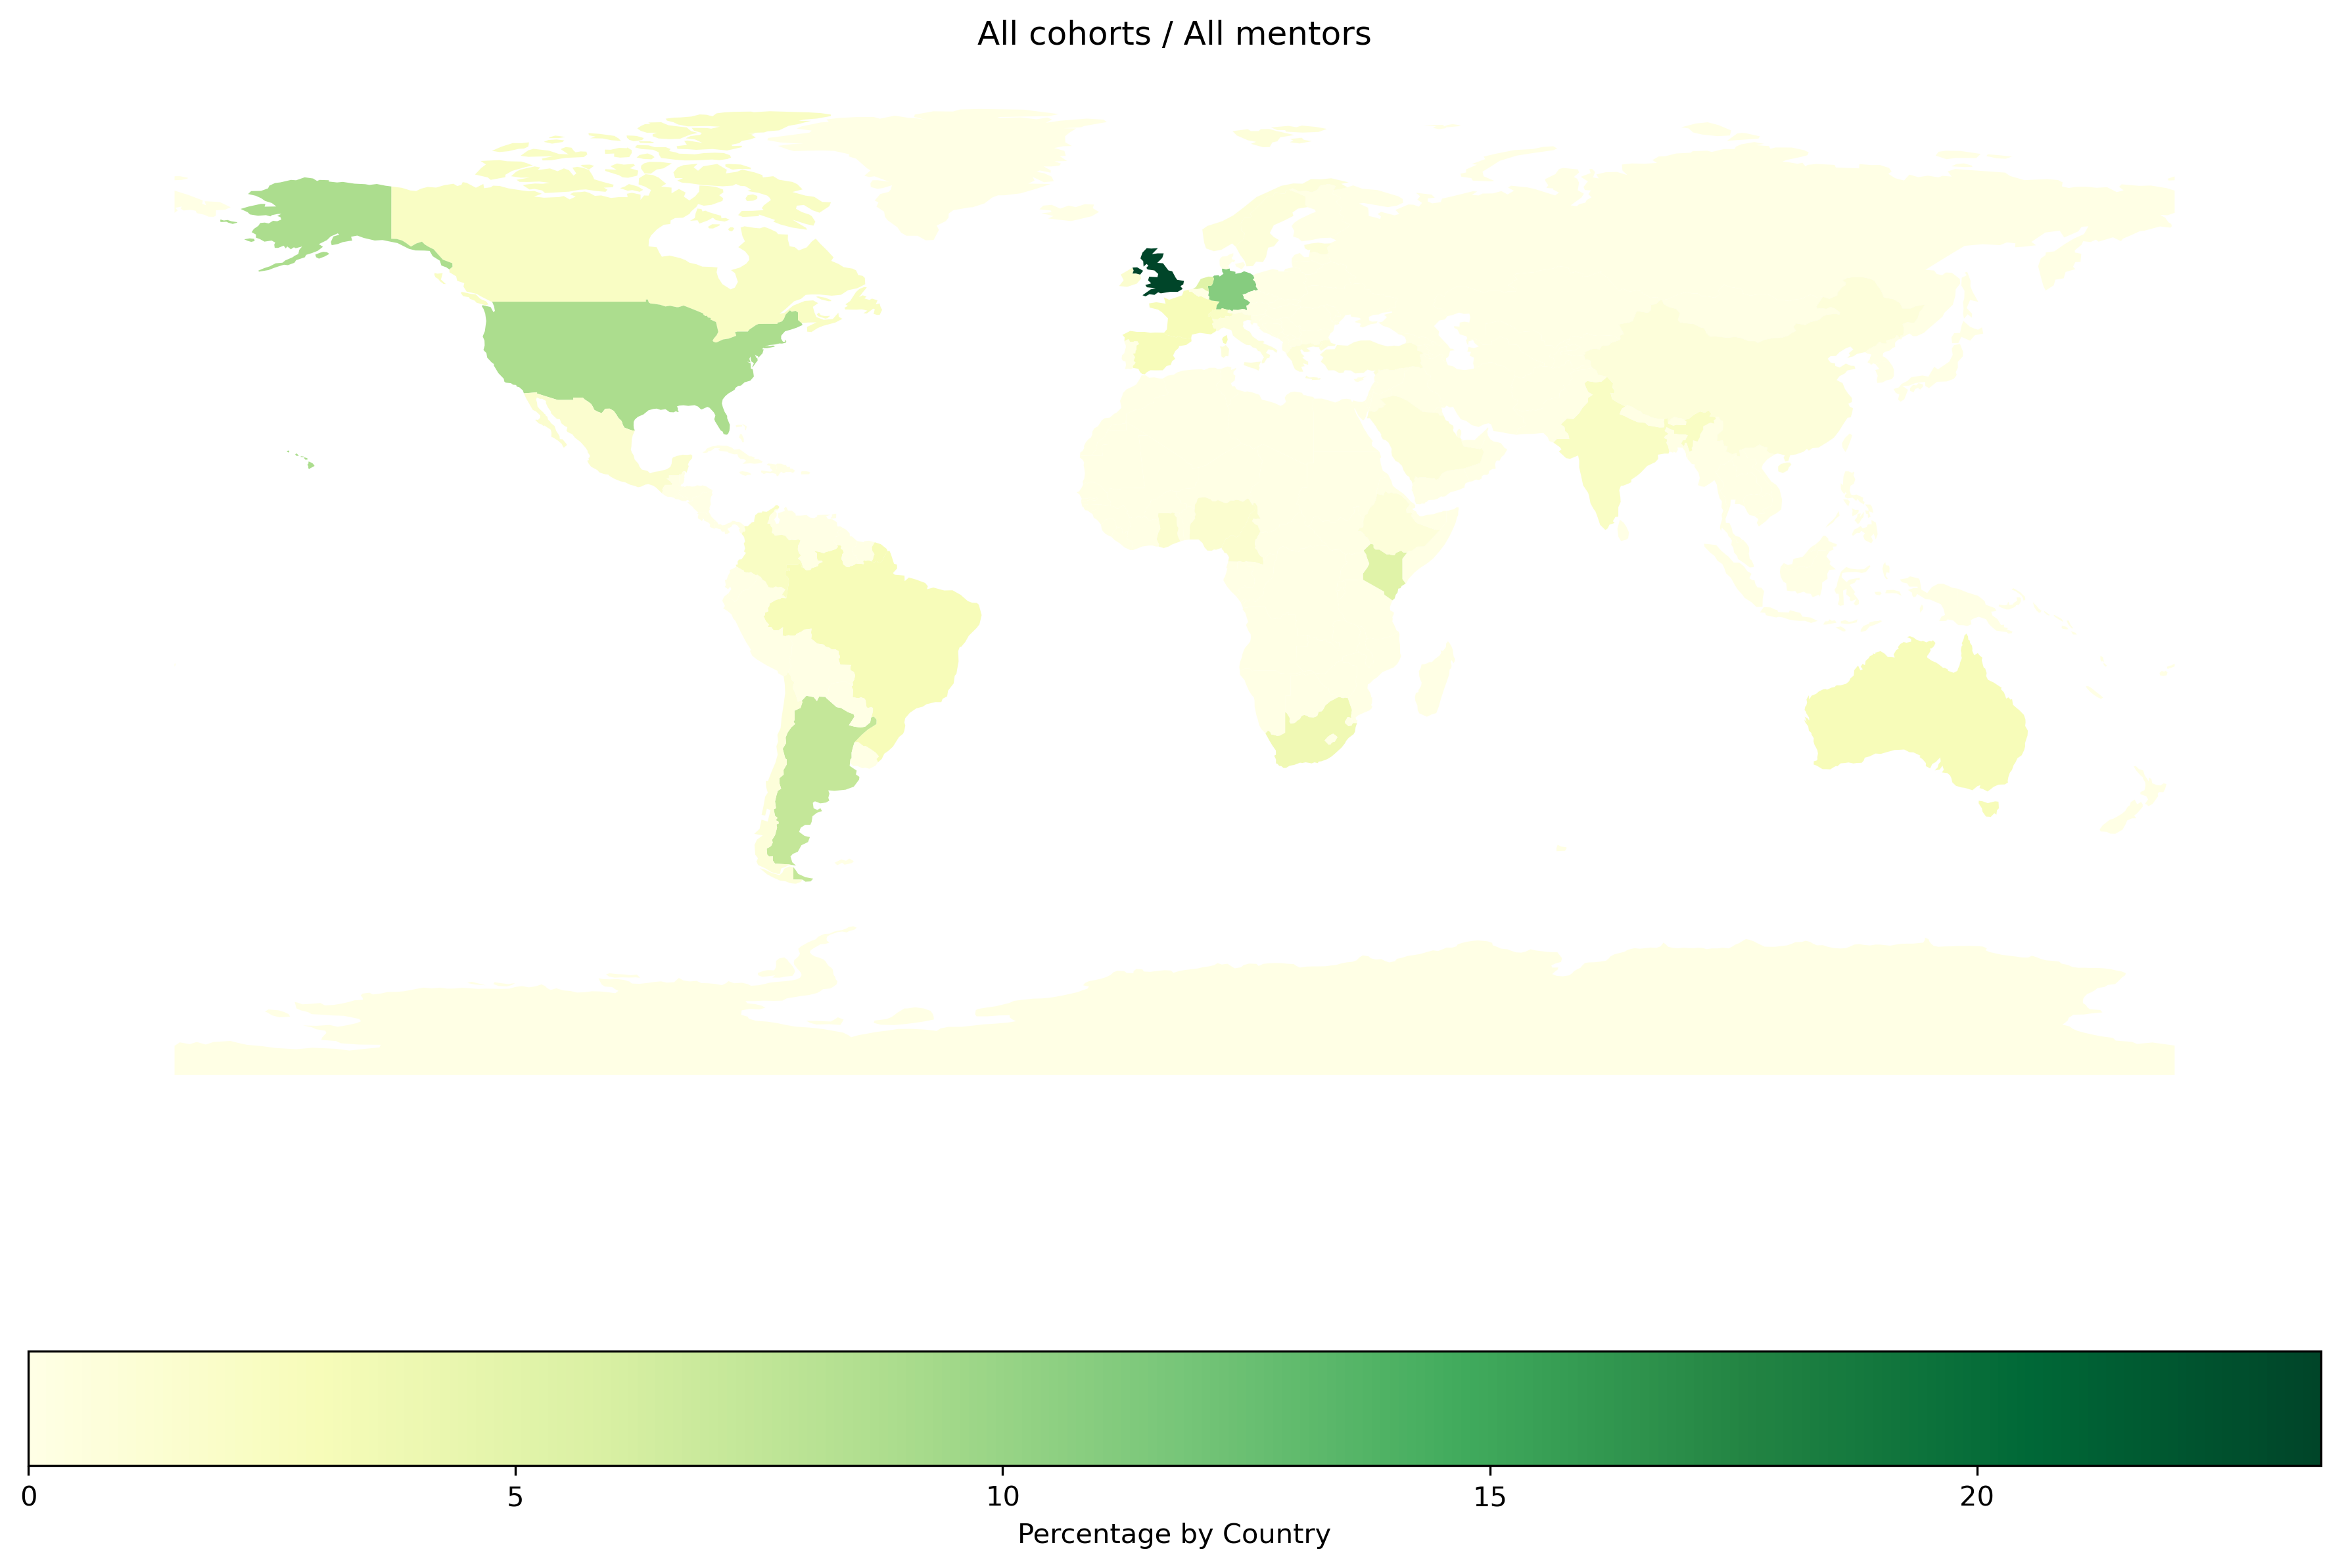
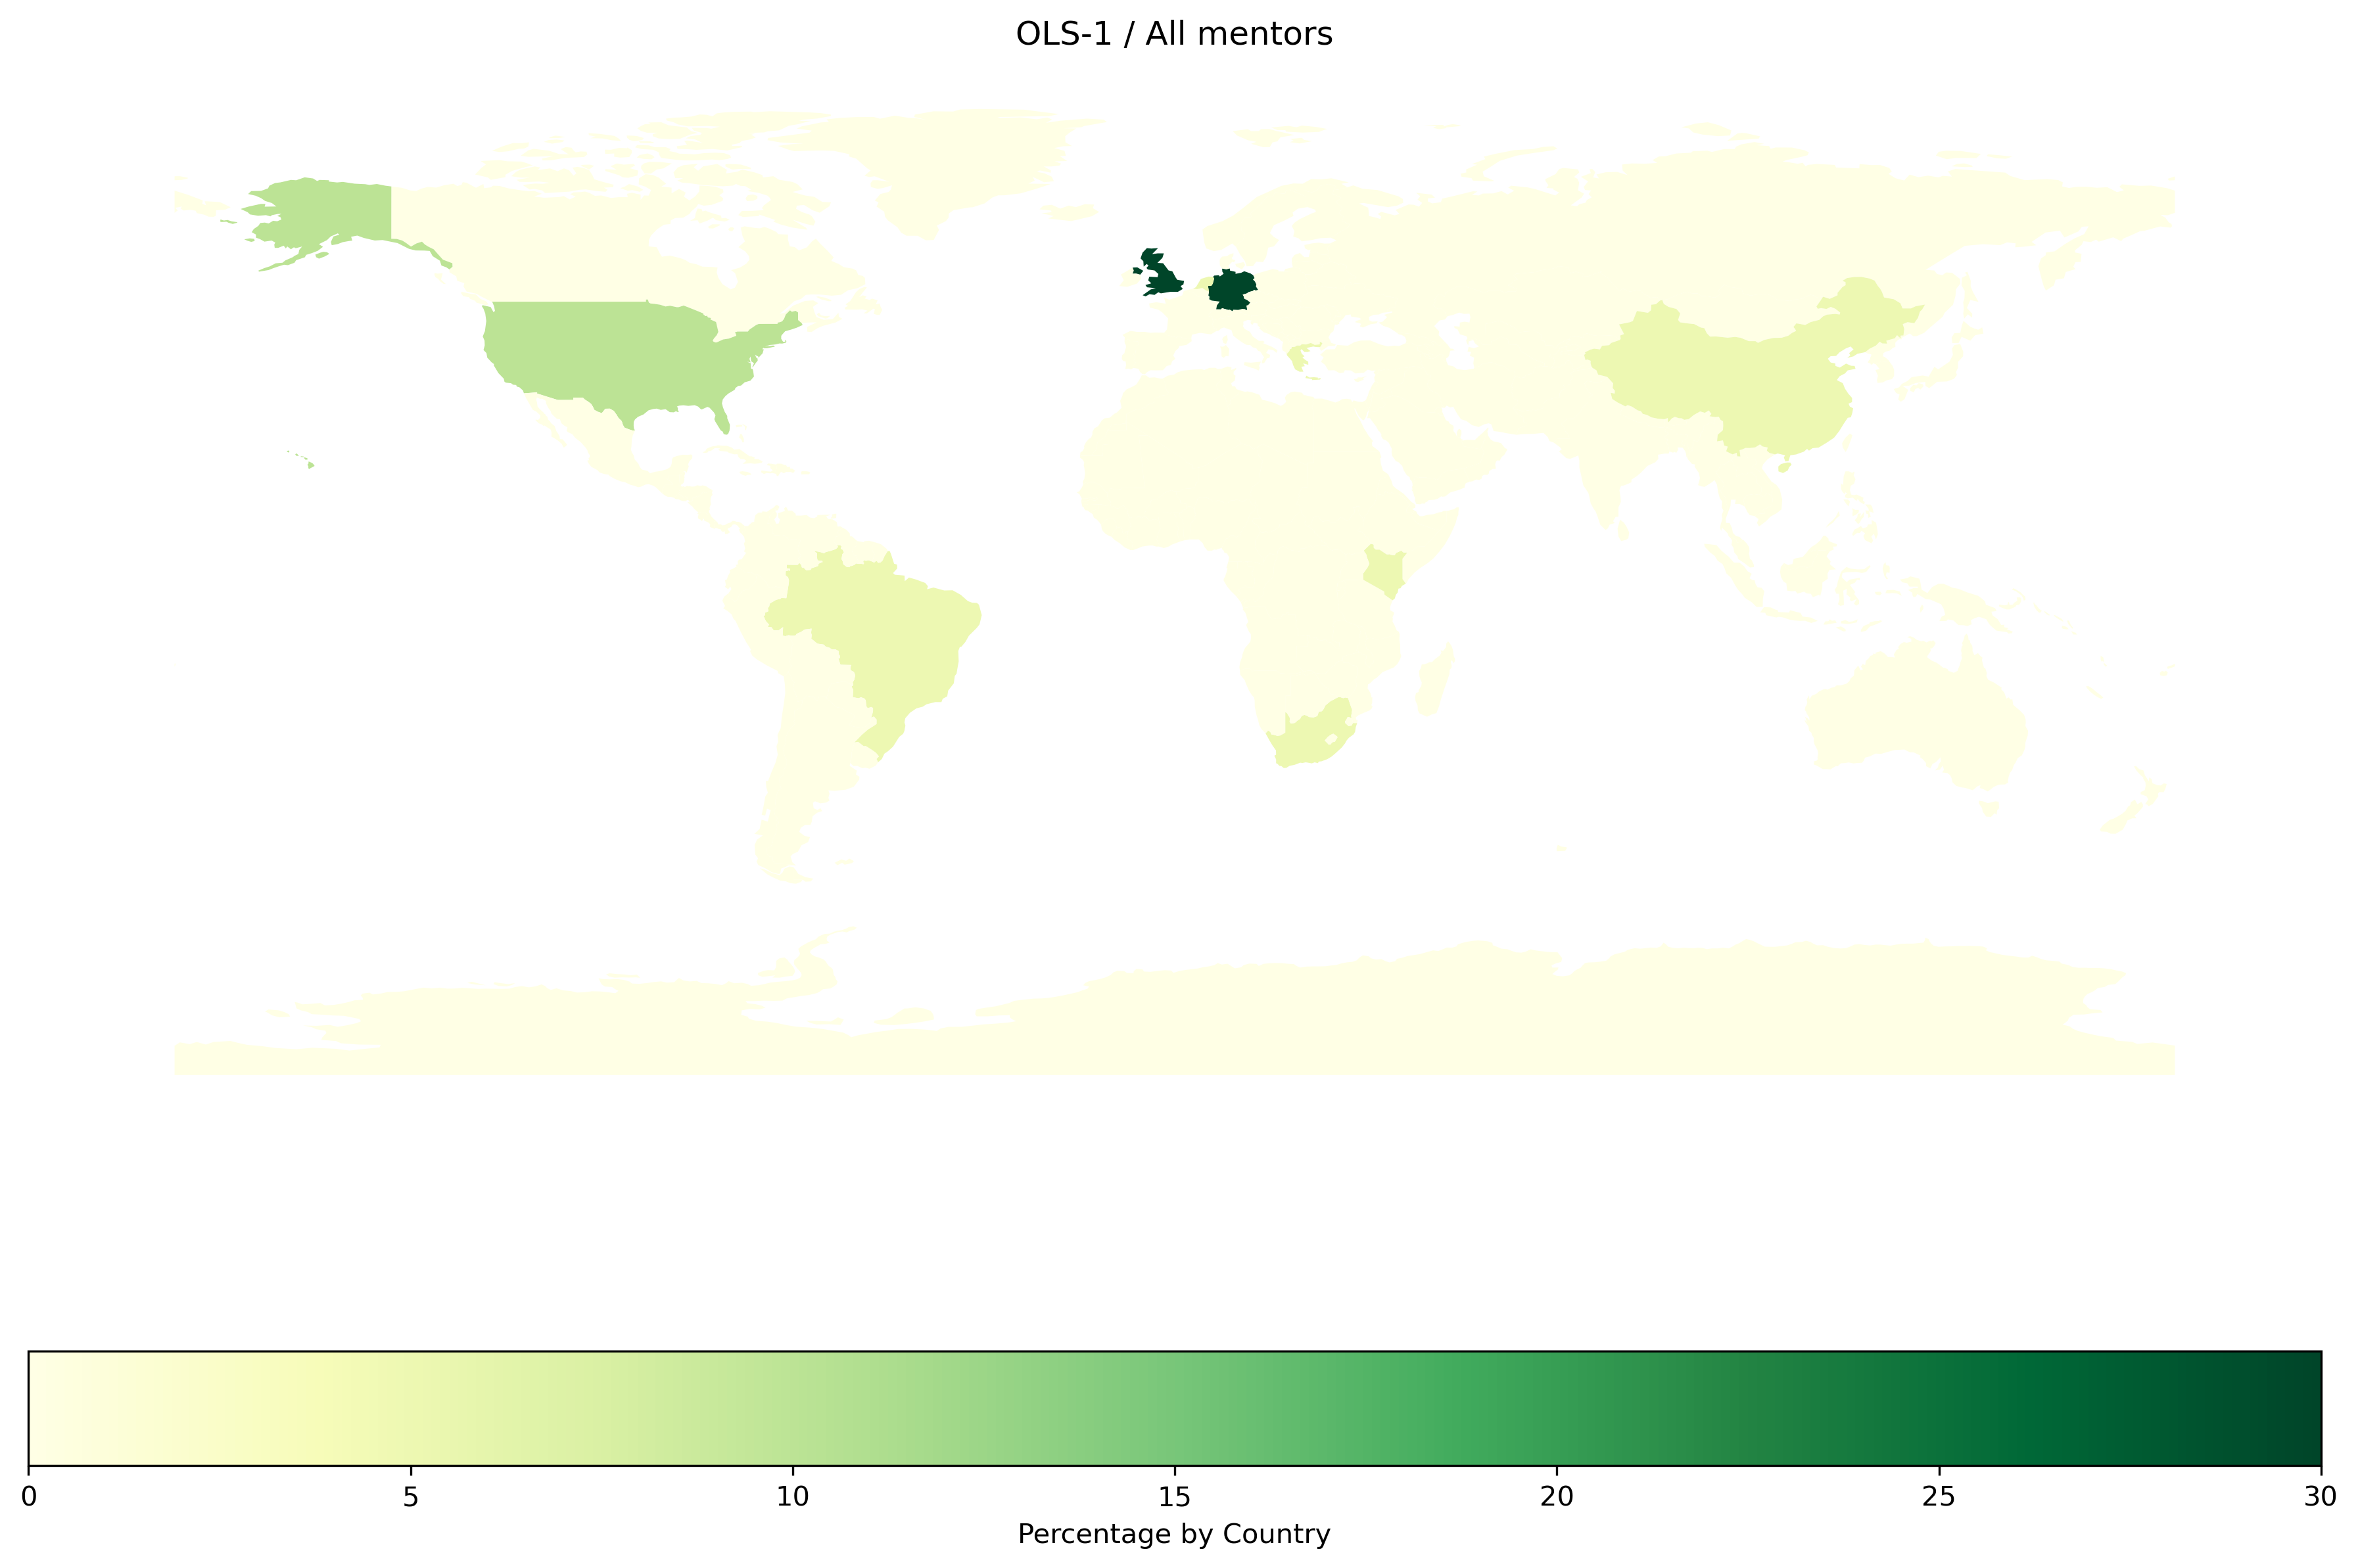
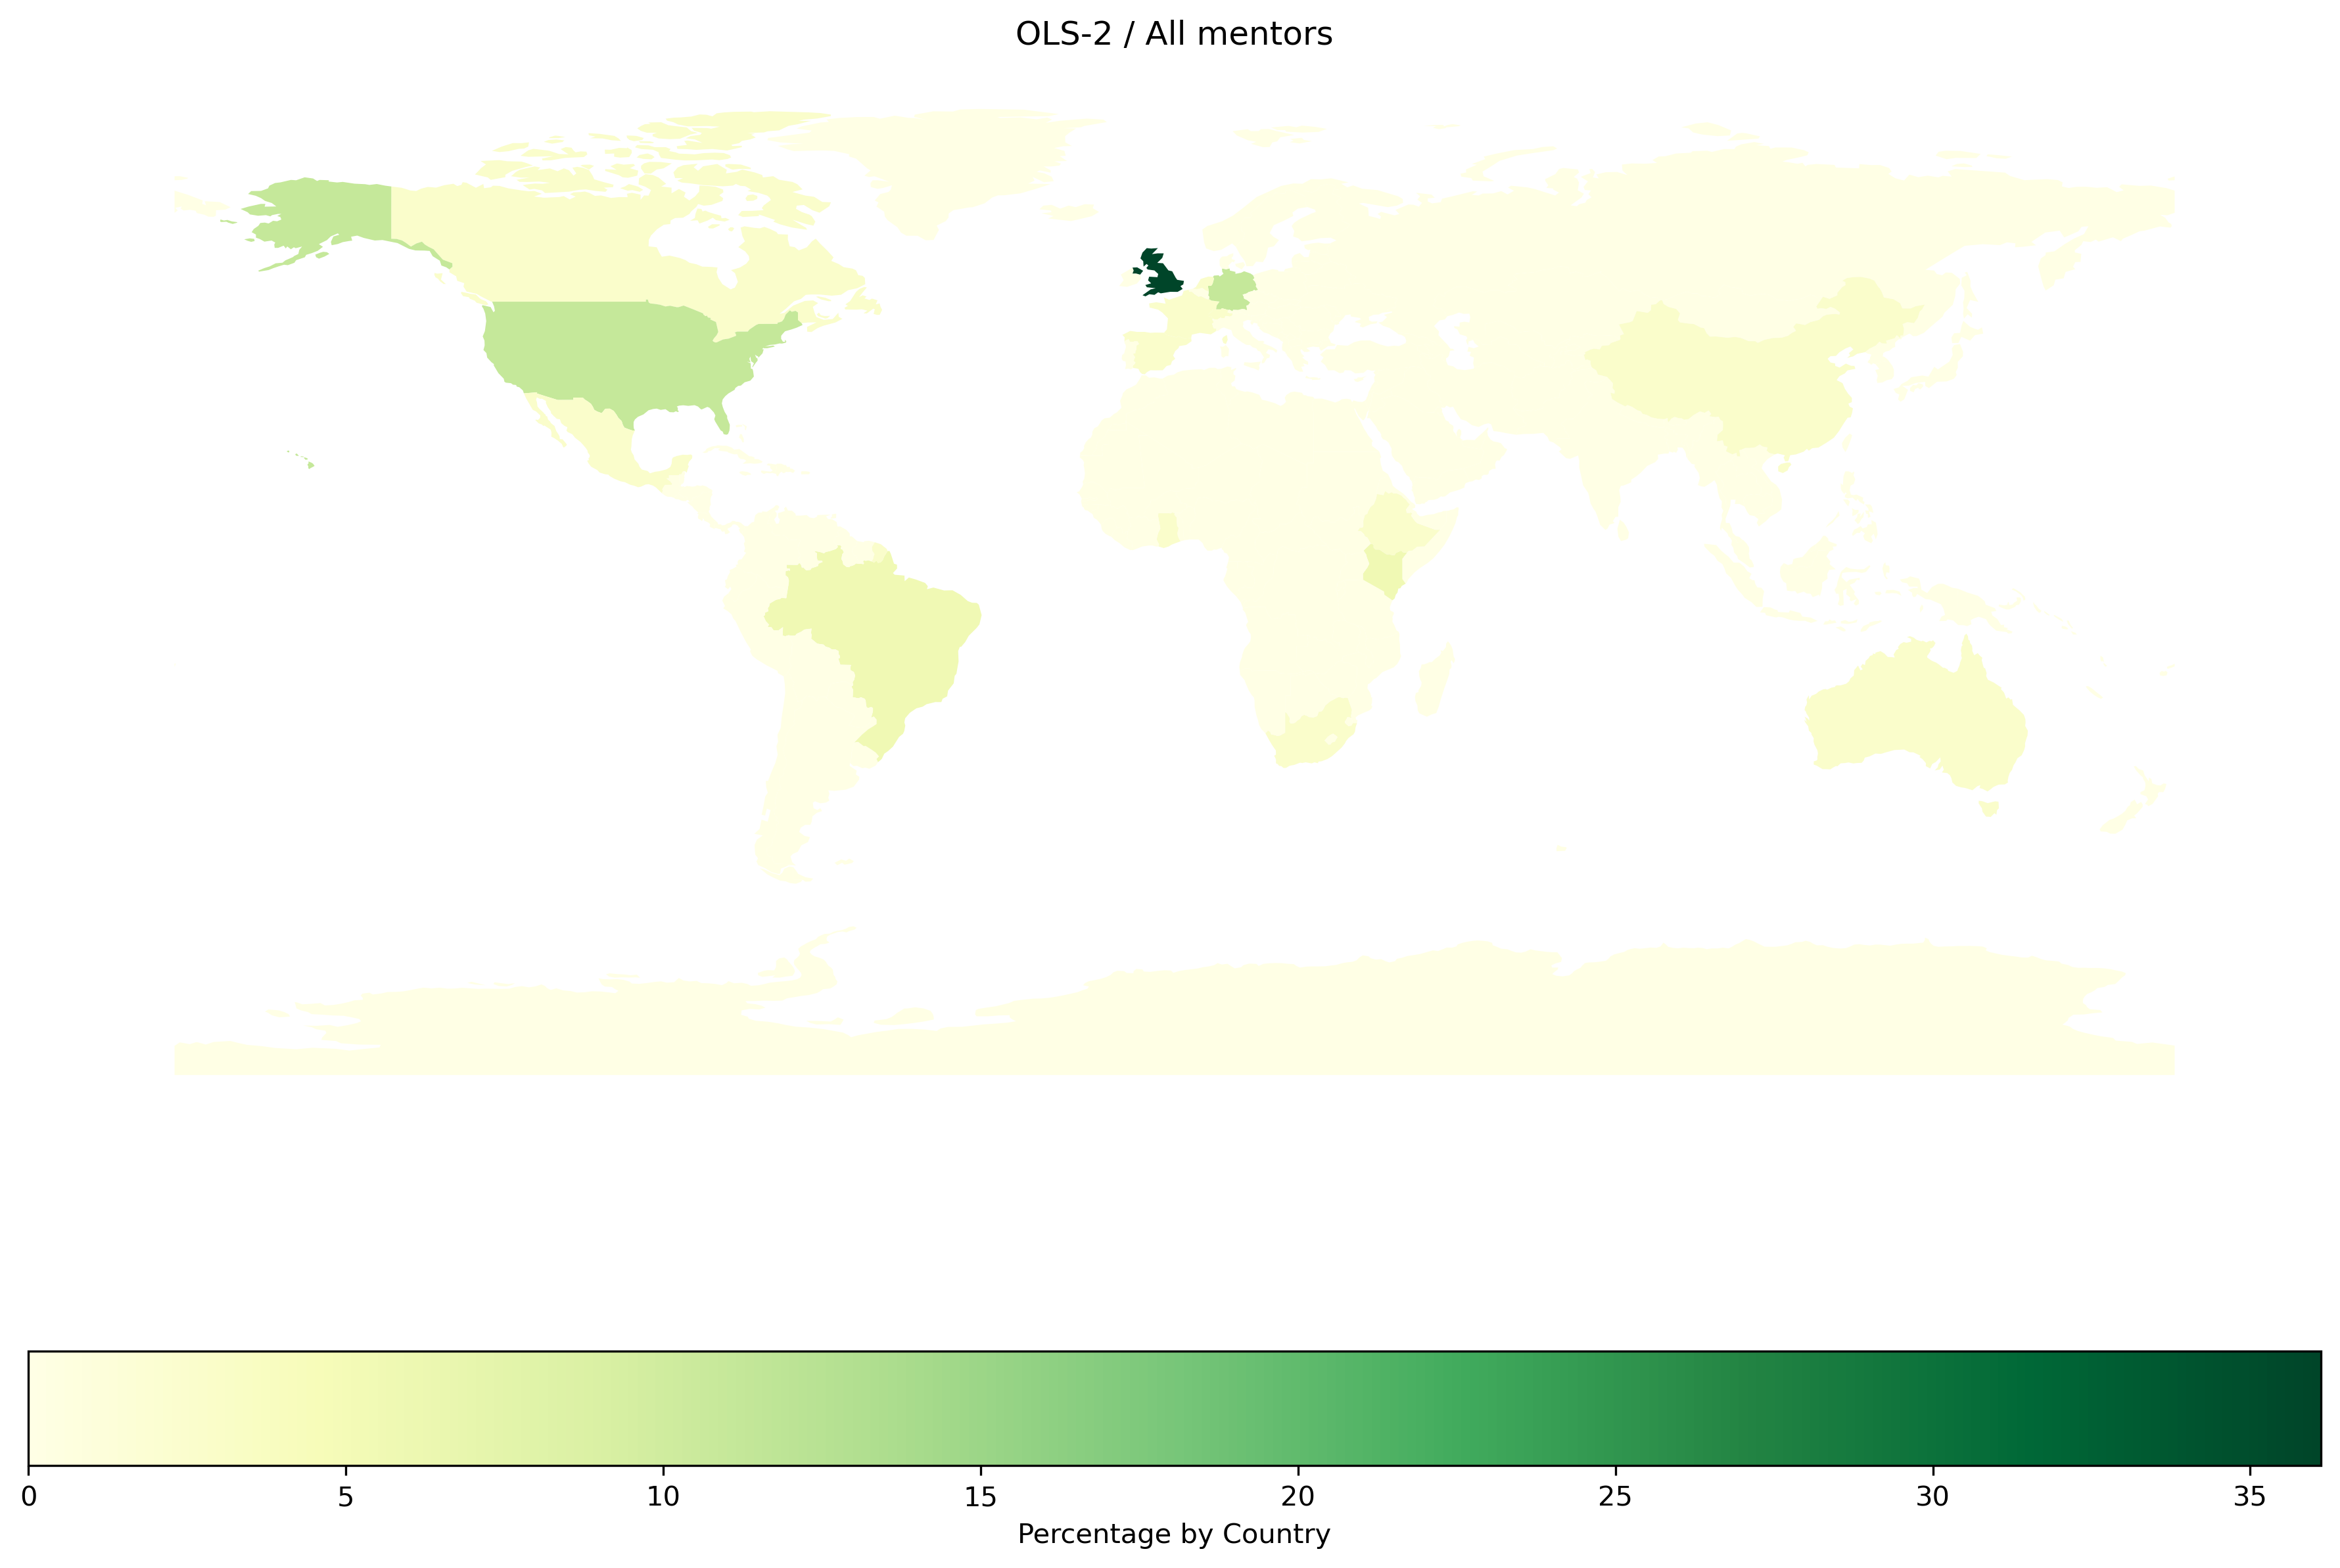
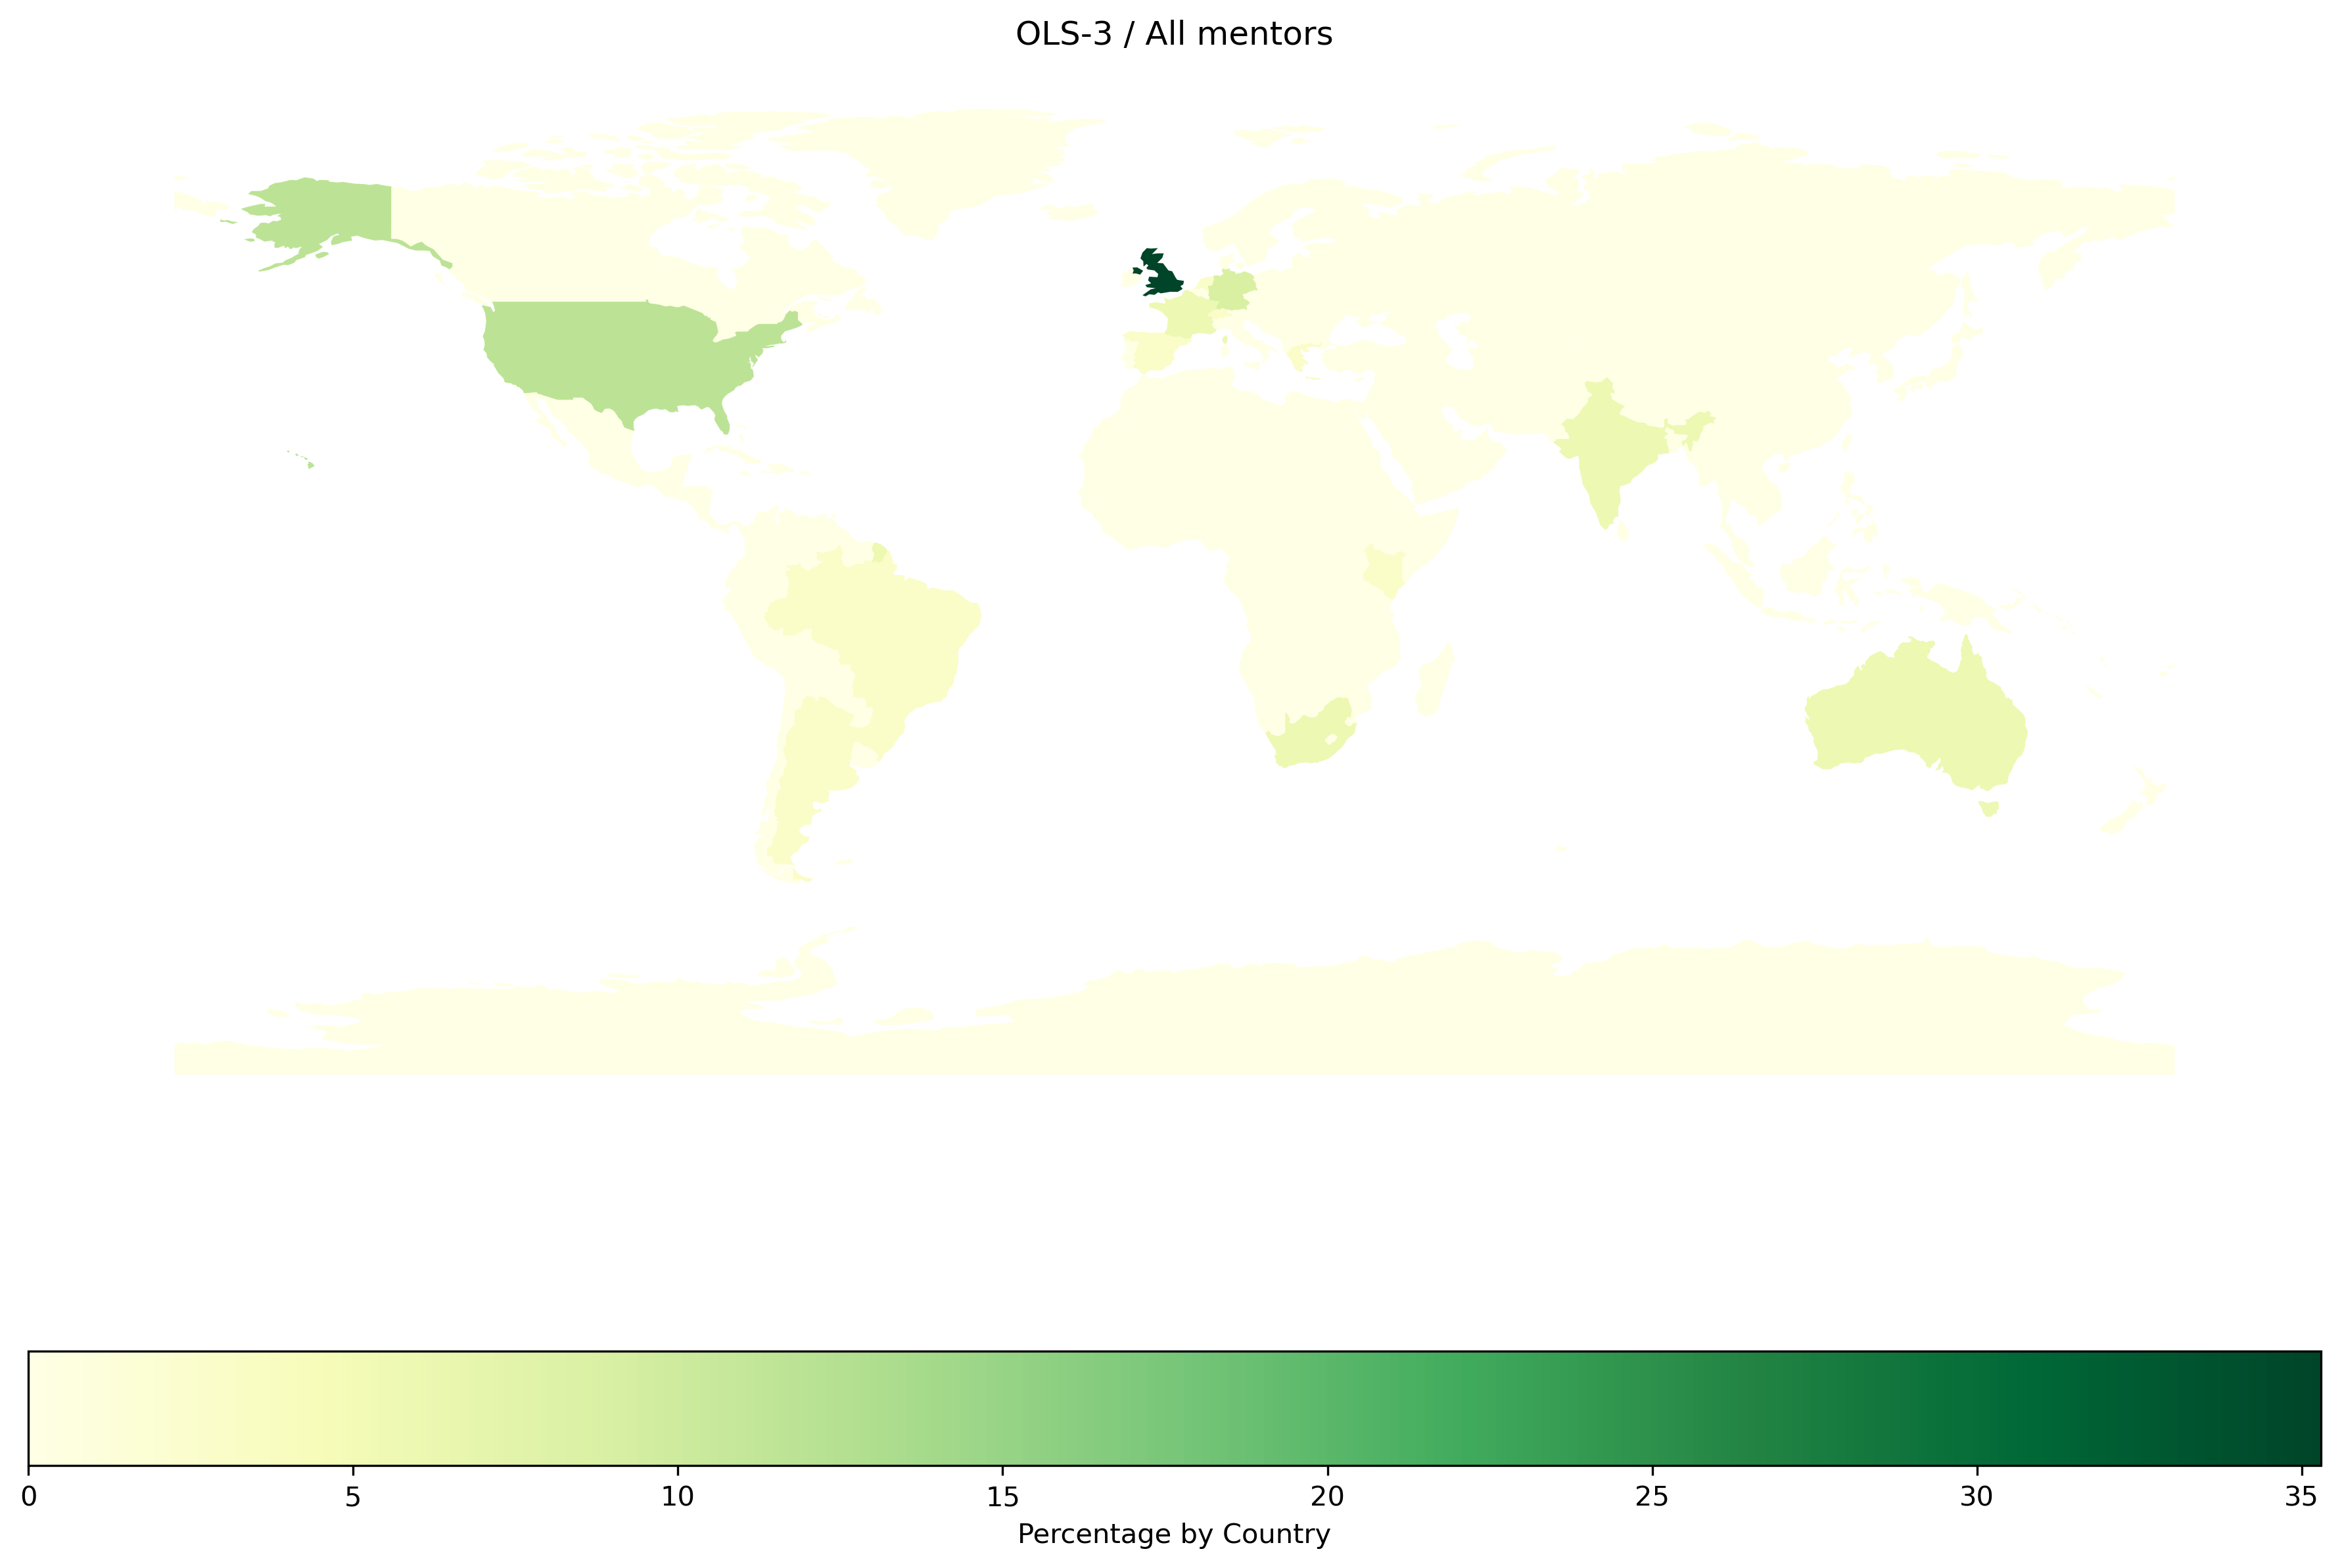
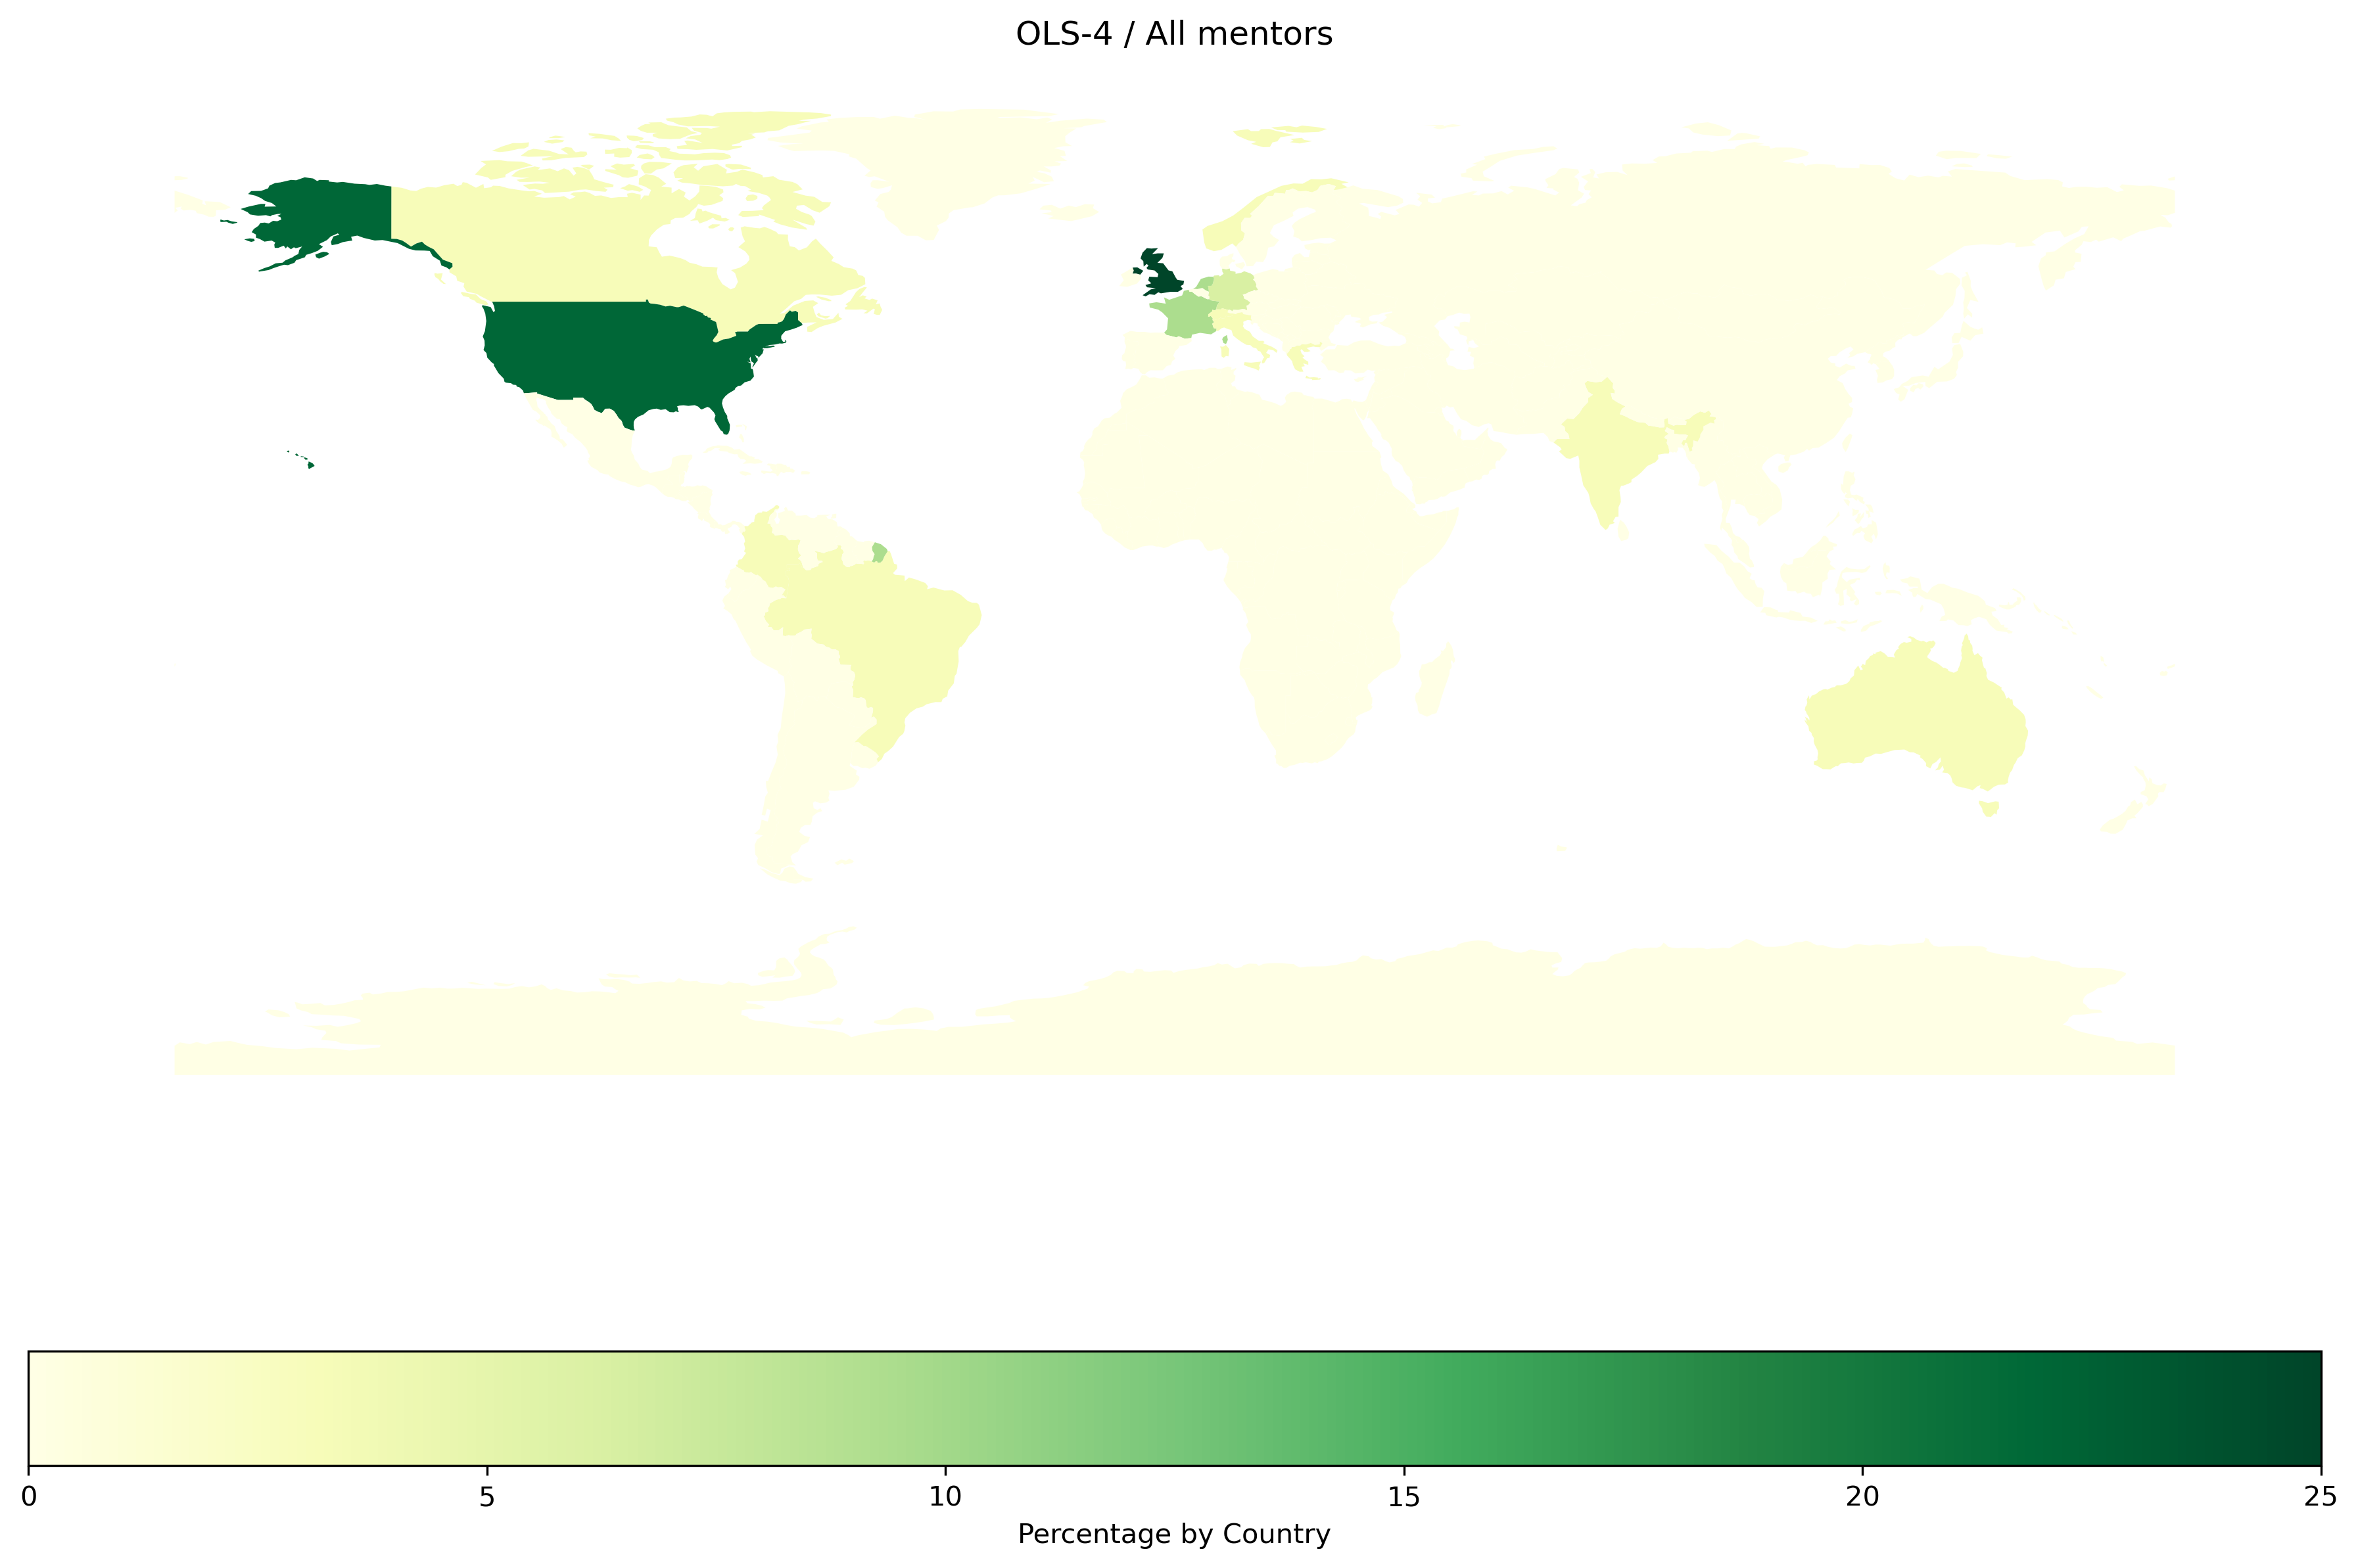
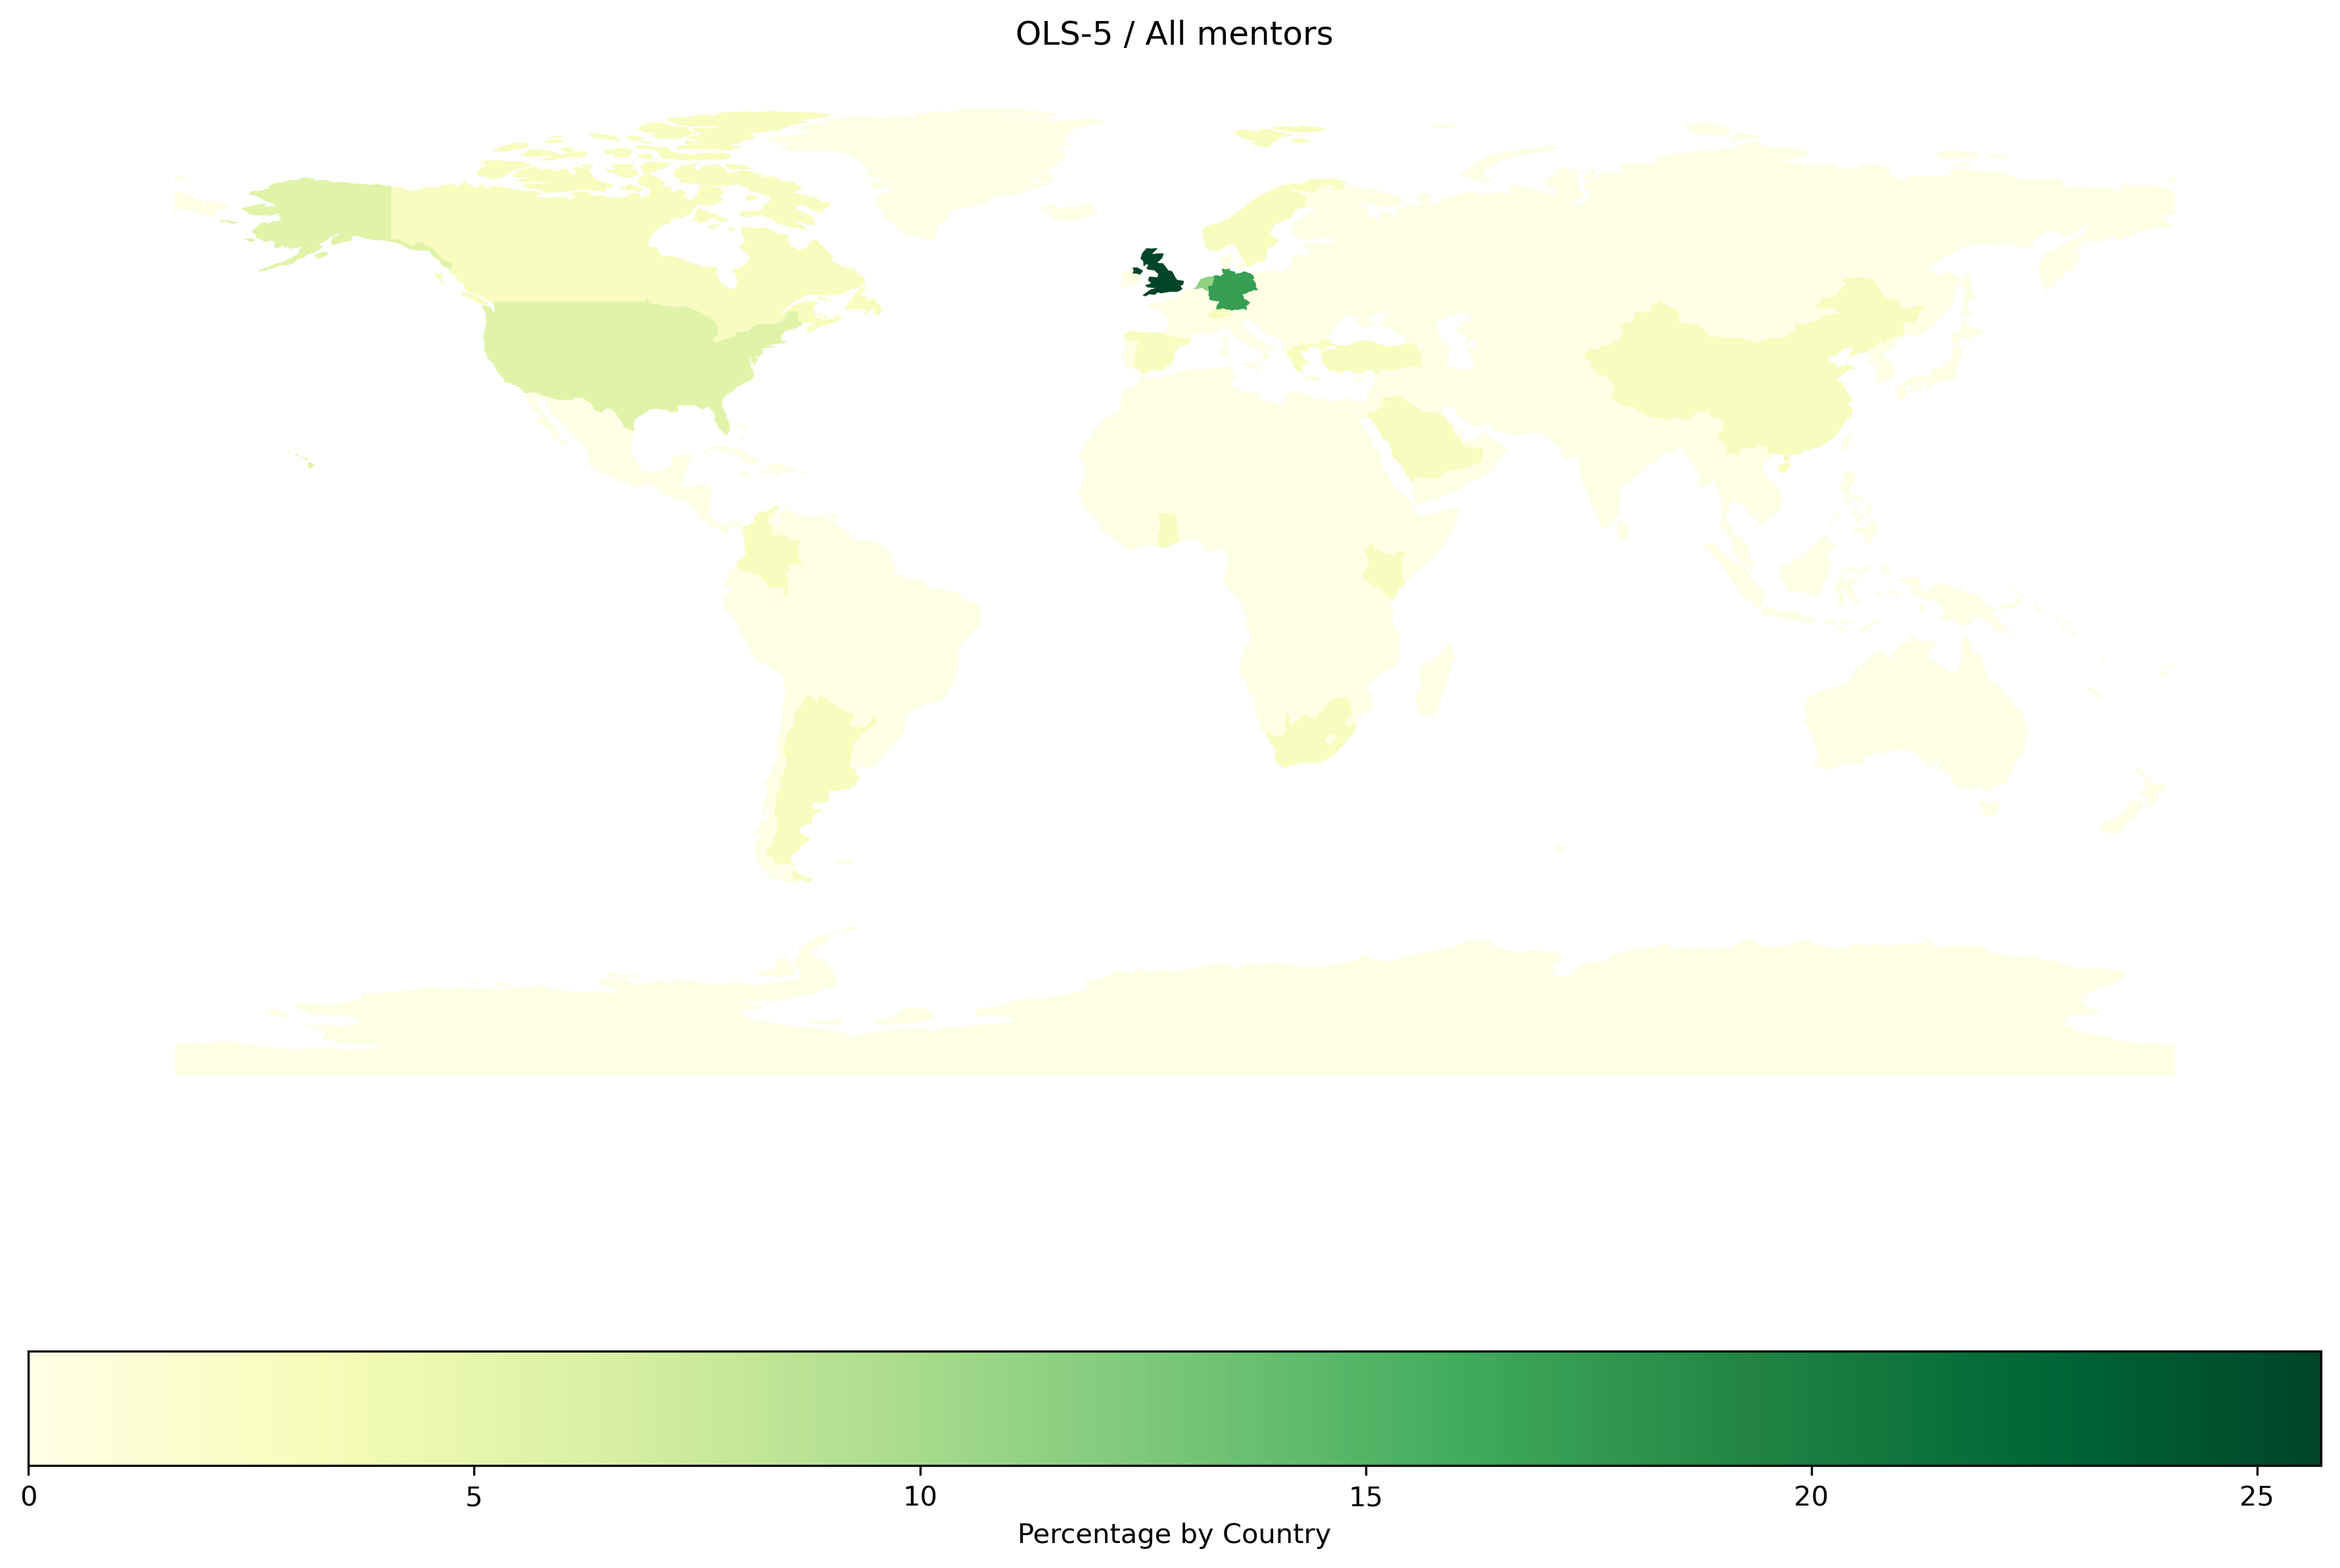
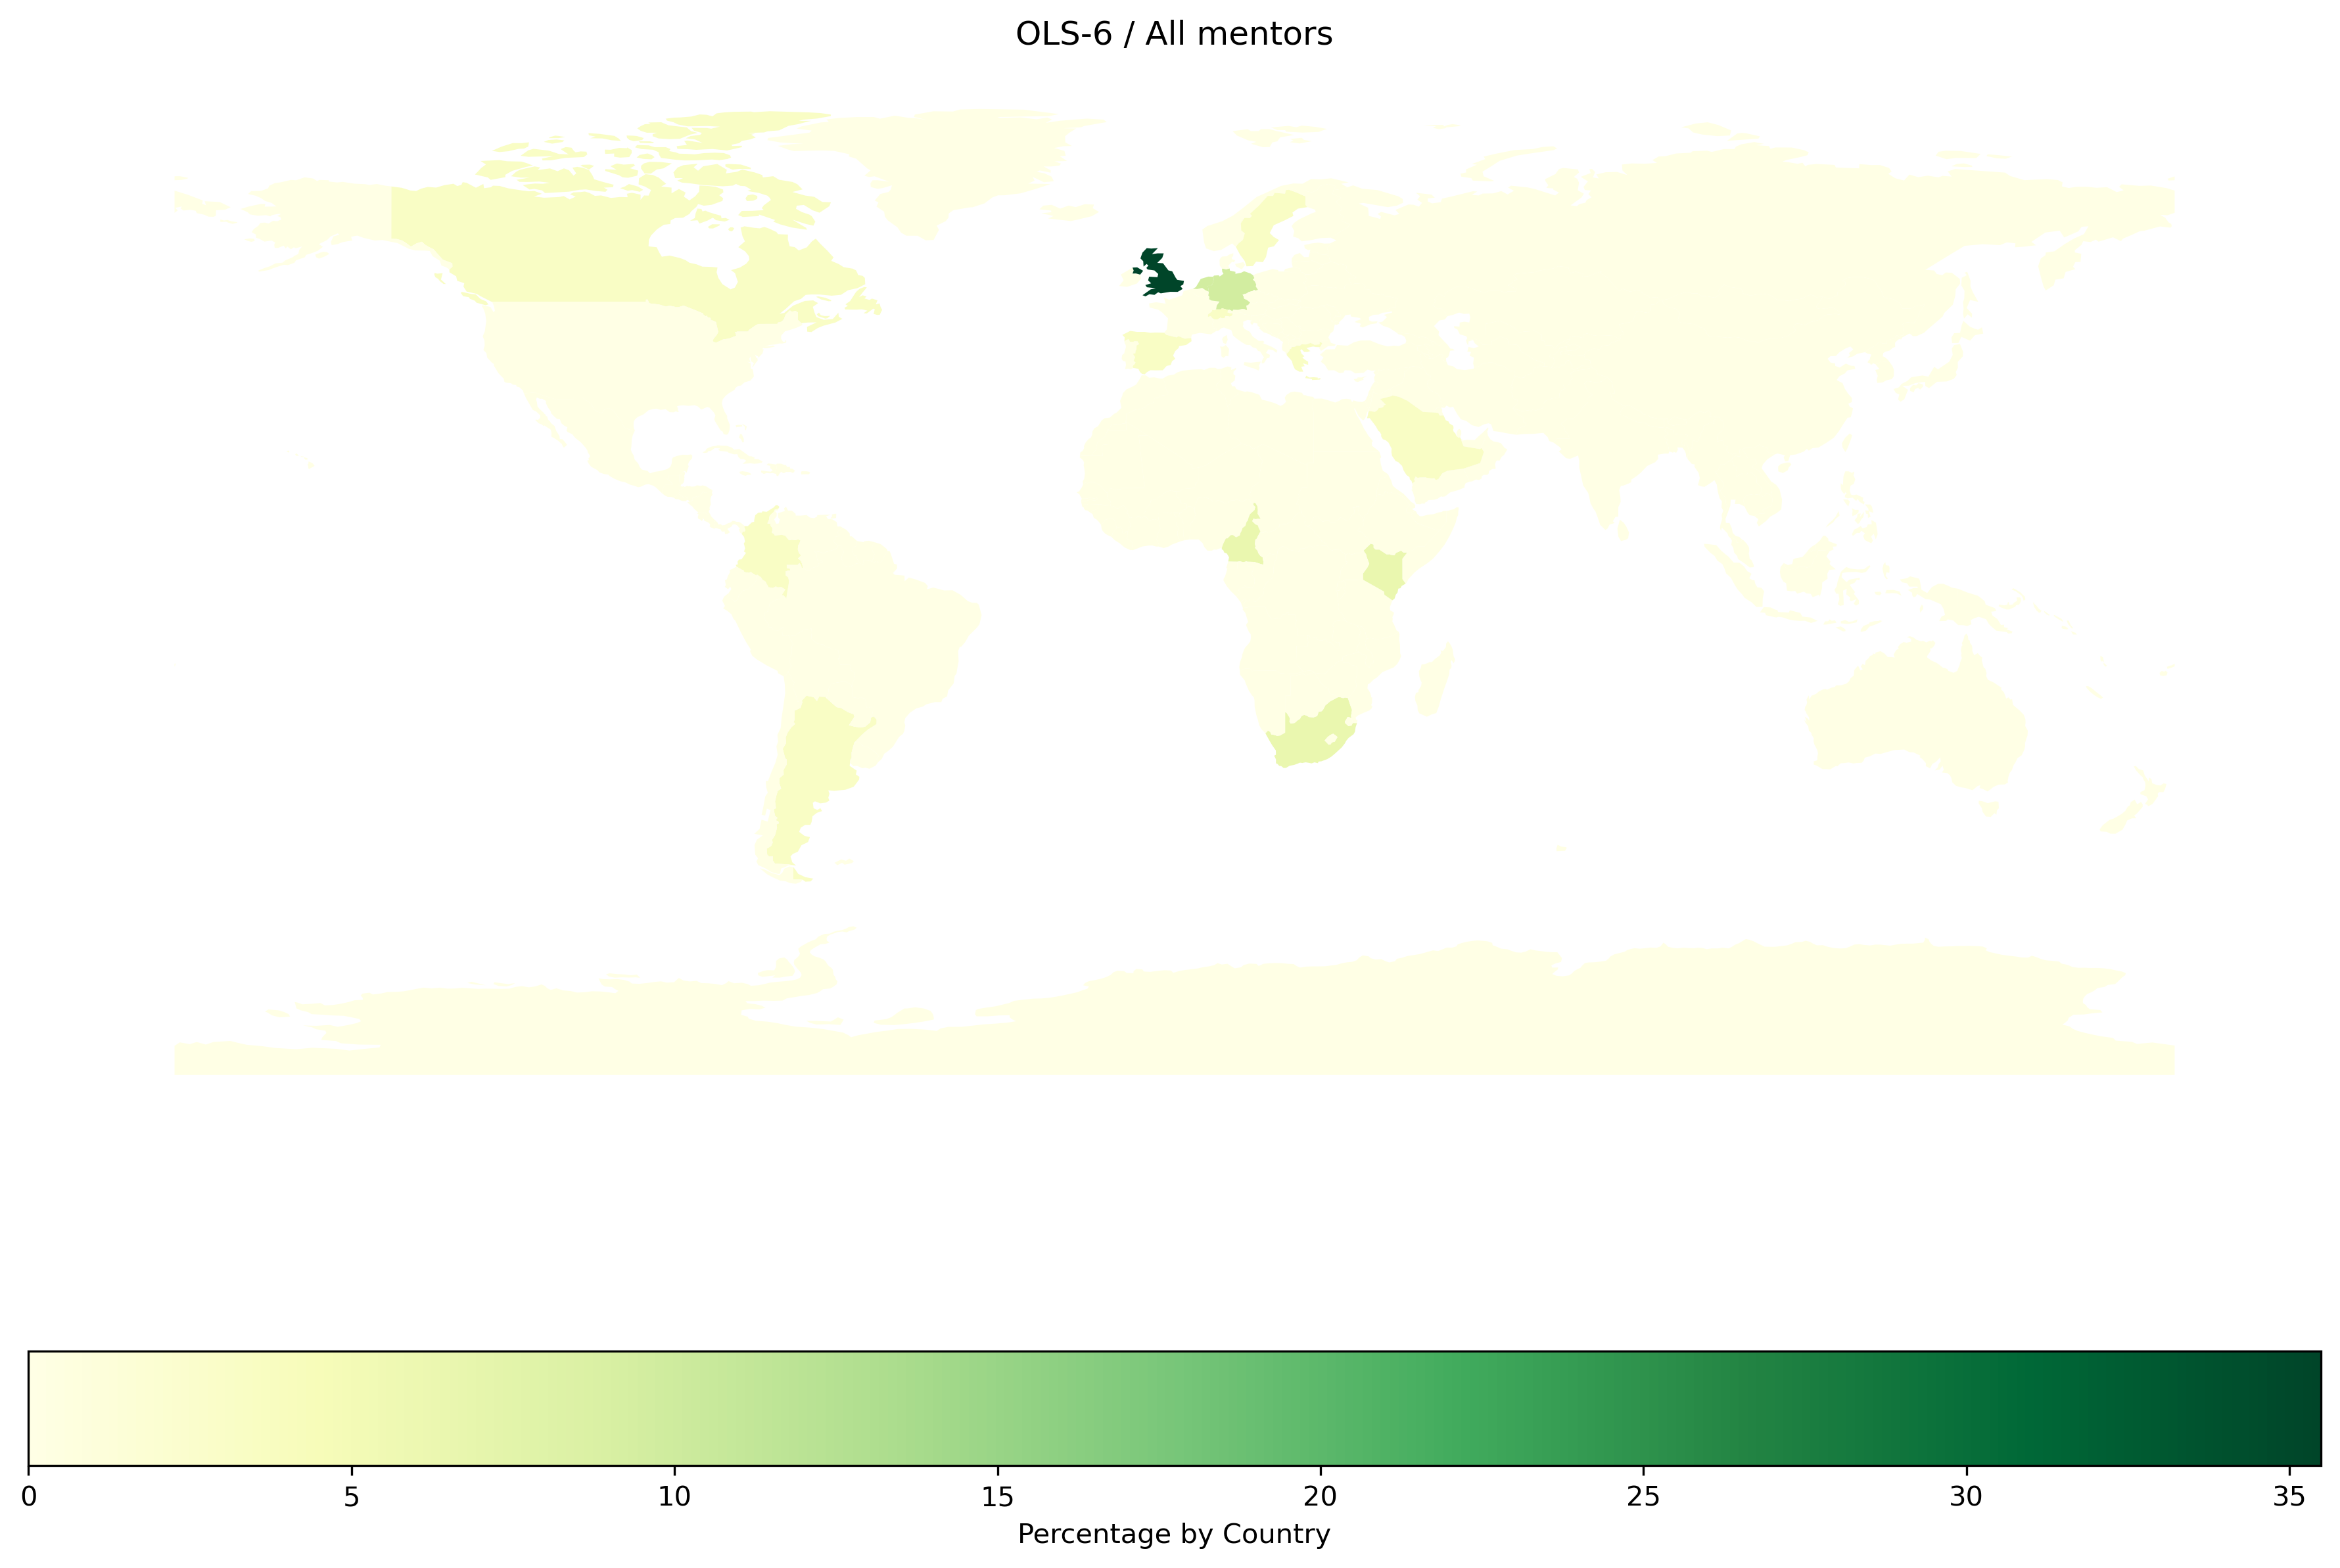
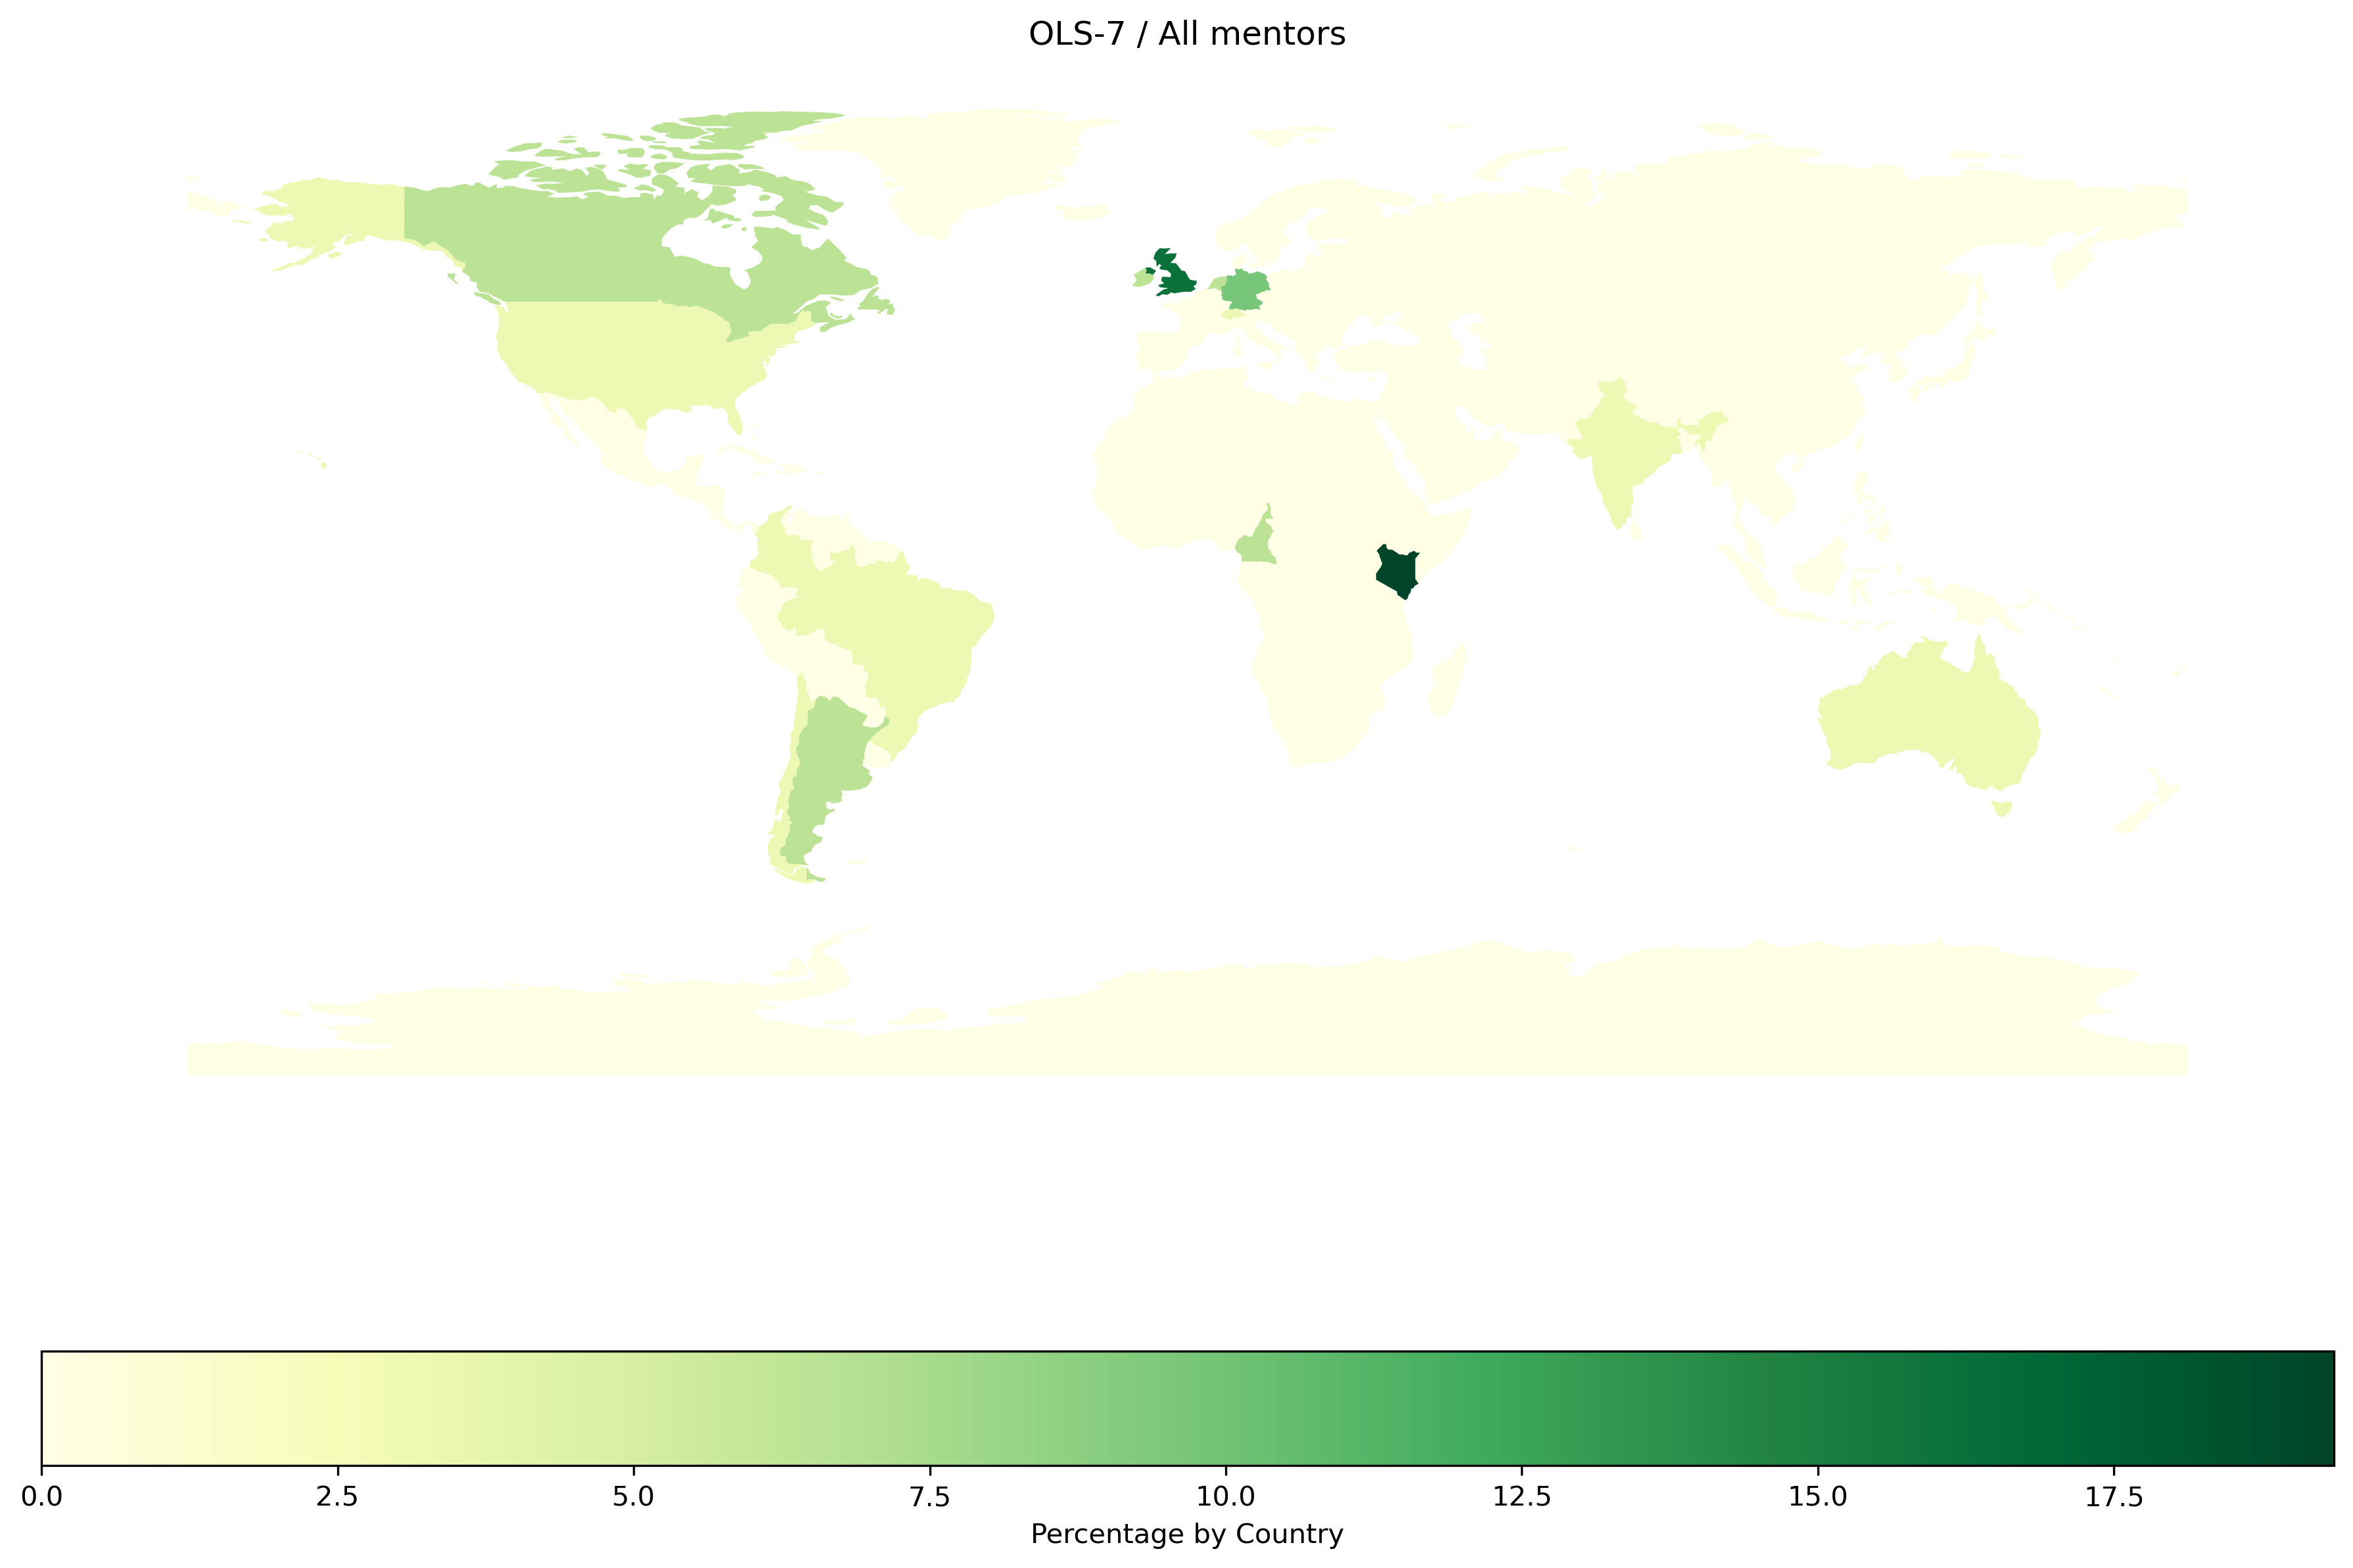
Mentors
|
TOTAL |
OLS-1 |
OLS-2 |
OLS-3 |
OLS-4 |
OLS-5 |
OLS-6 |
OLS-7 |
OLS-8 |
| continent |
|
|
|
|
|
|
|
|
|
| Africa |
13.970588 |
10.0 |
13.888889 |
8.823529 |
0.000 |
8.571429 |
19.354839 |
25.806452 |
18.421053 |
| Asia |
4.411765 |
5.0 |
2.777778 |
5.882353 |
3.125 |
8.571429 |
3.225806 |
3.225806 |
2.631579 |
| Europe |
52.941176 |
70.0 |
58.333333 |
61.764706 |
62.500 |
68.571429 |
67.741935 |
41.935484 |
47.368421 |
| North America |
12.500000 |
10.0 |
16.666667 |
11.764706 |
25.000 |
8.571429 |
3.225806 |
9.677419 |
2.631579 |
| Oceania |
2.941176 |
0.0 |
2.777778 |
5.882353 |
3.125 |
0.000000 |
0.000000 |
3.225806 |
0.000000 |
| South America |
13.235294 |
5.0 |
5.555556 |
5.882353 |
6.250 |
5.714286 |
6.451613 |
16.129032 |
28.947368 |
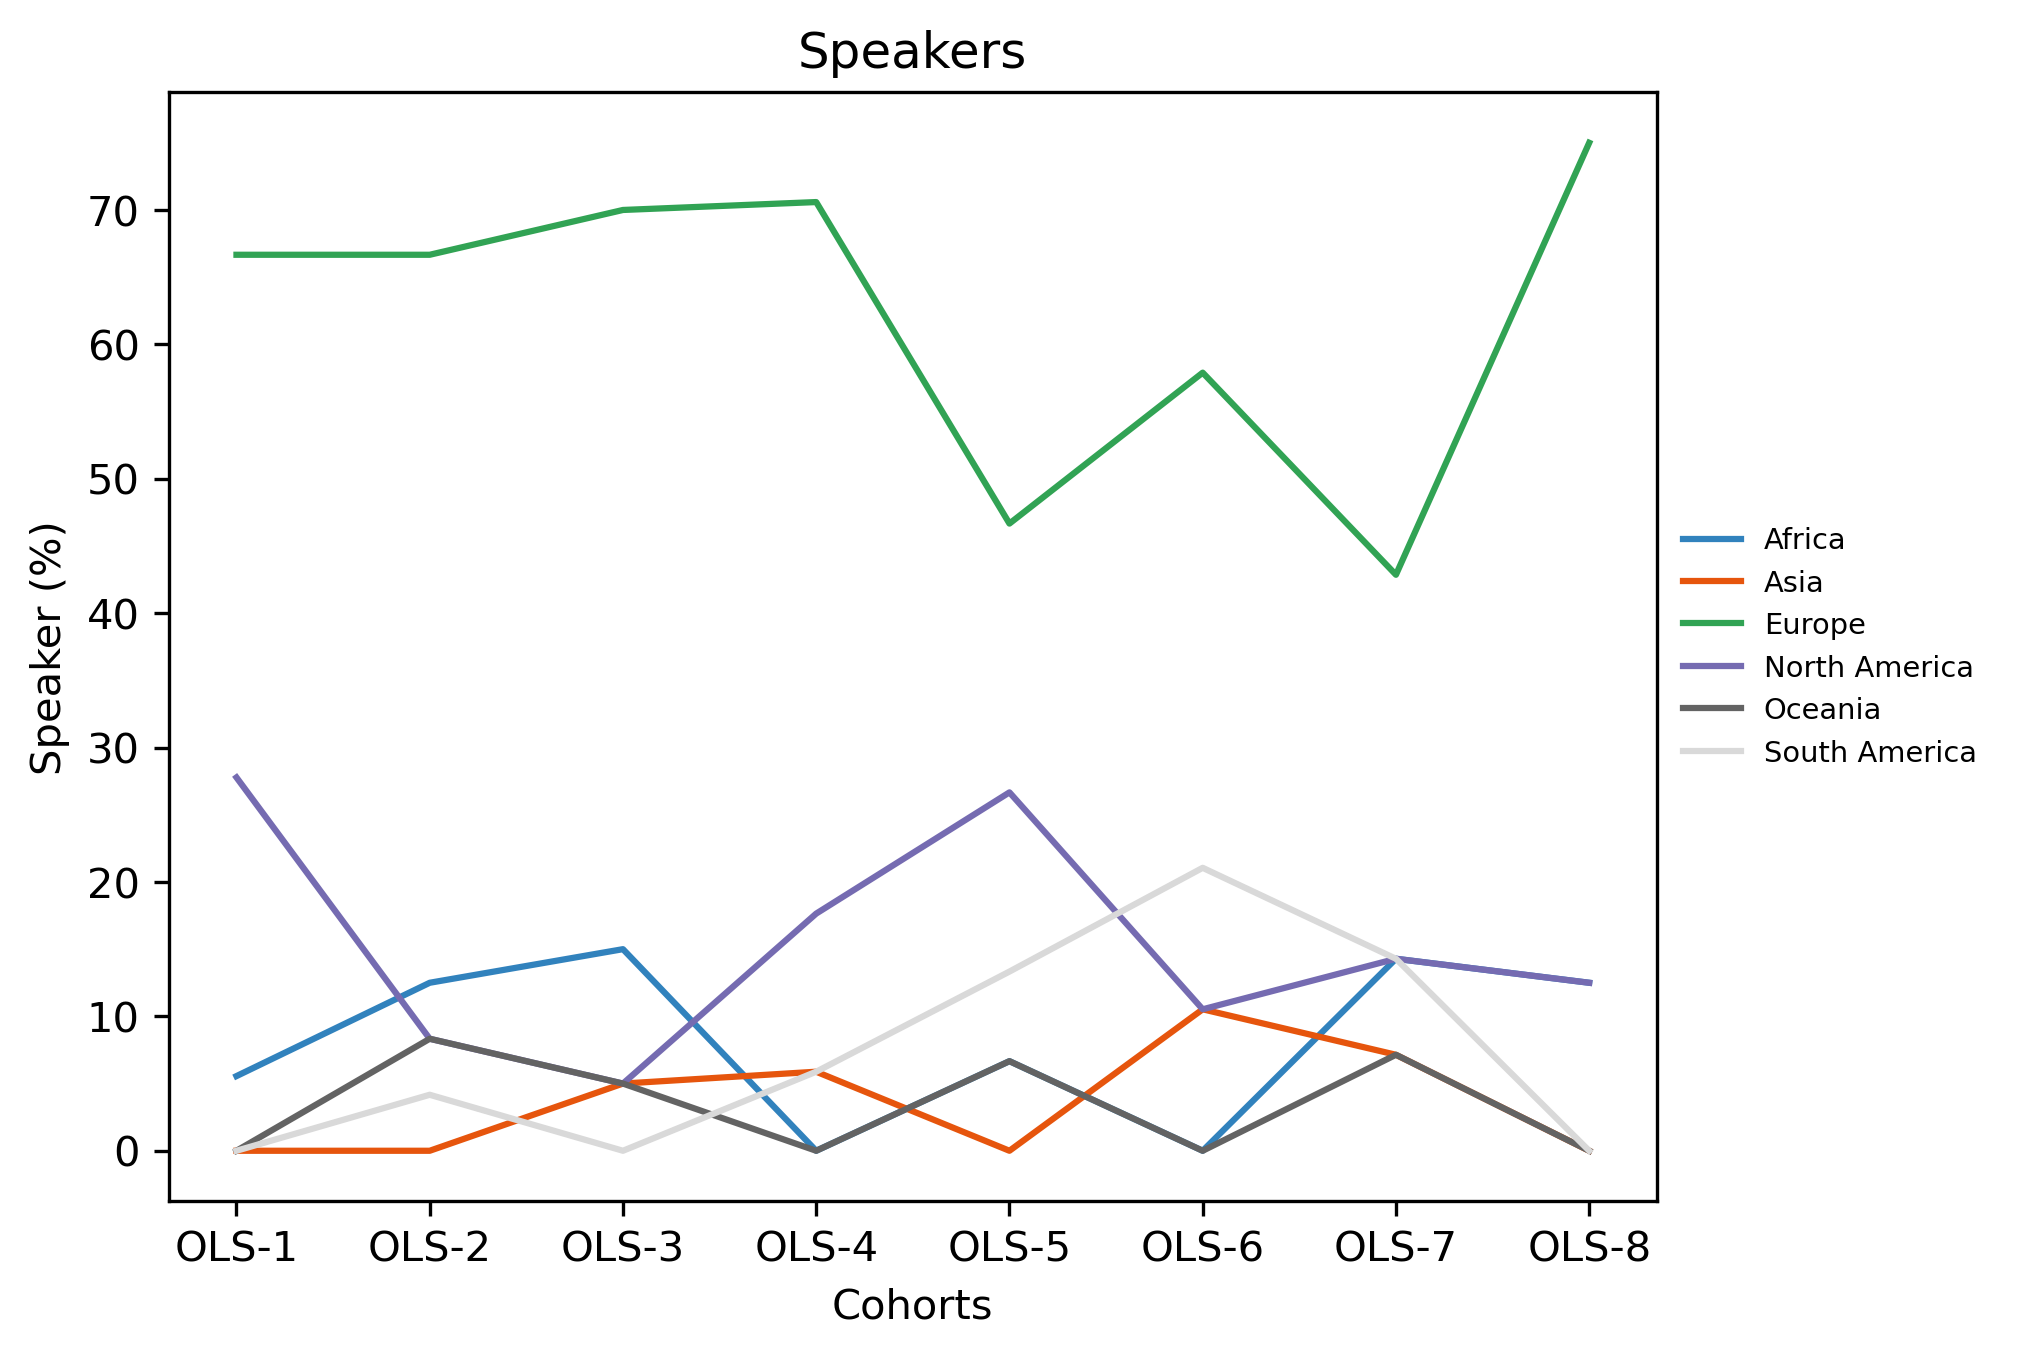
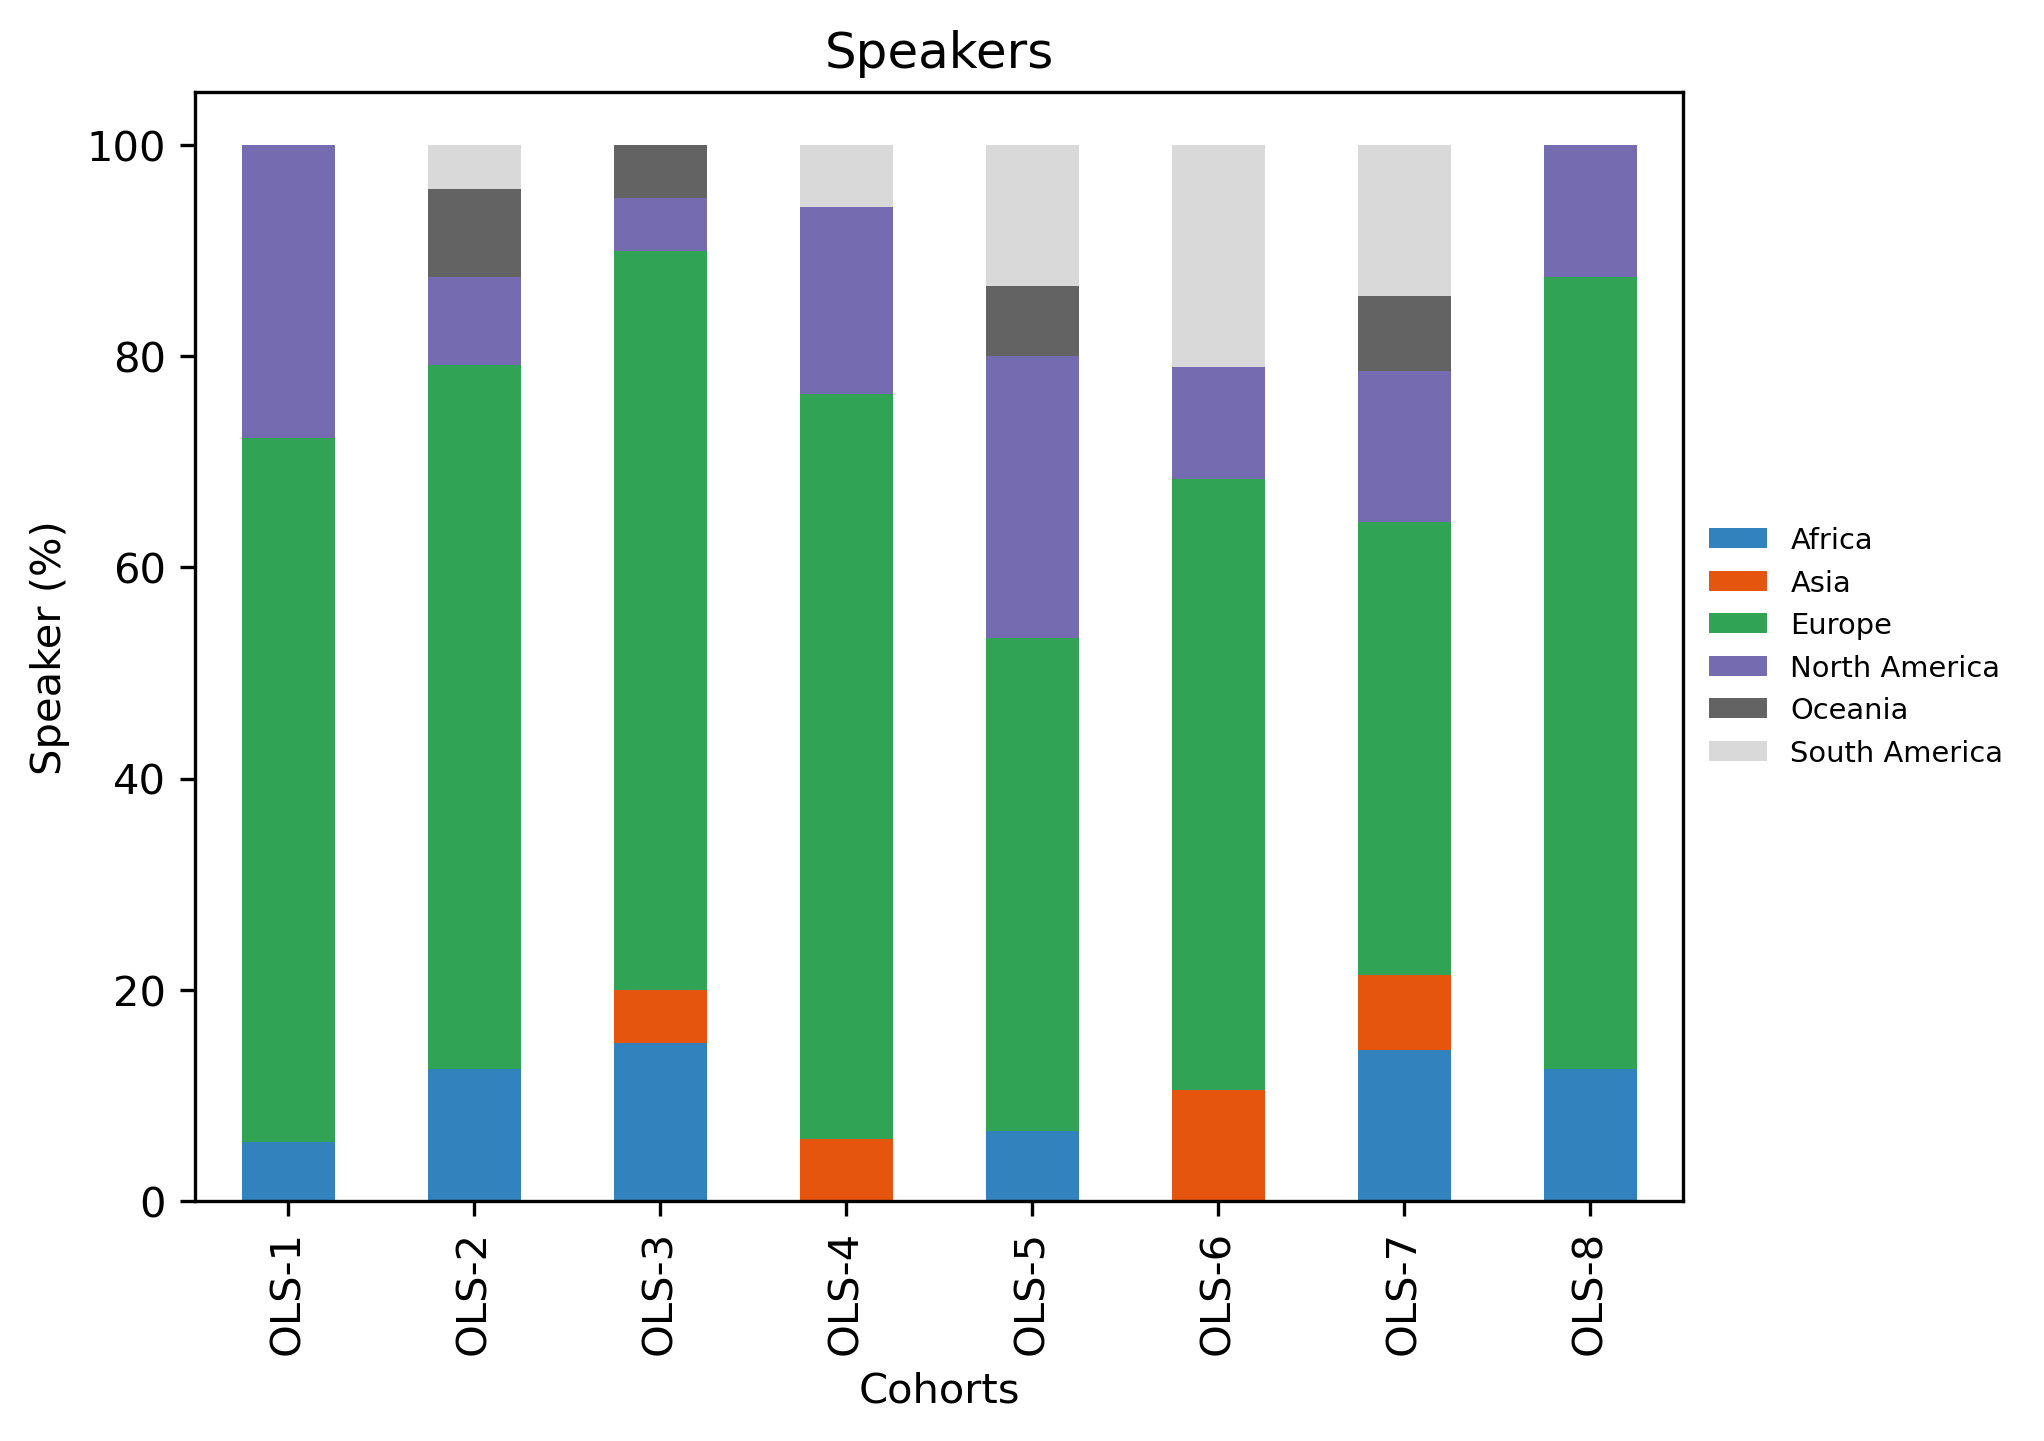
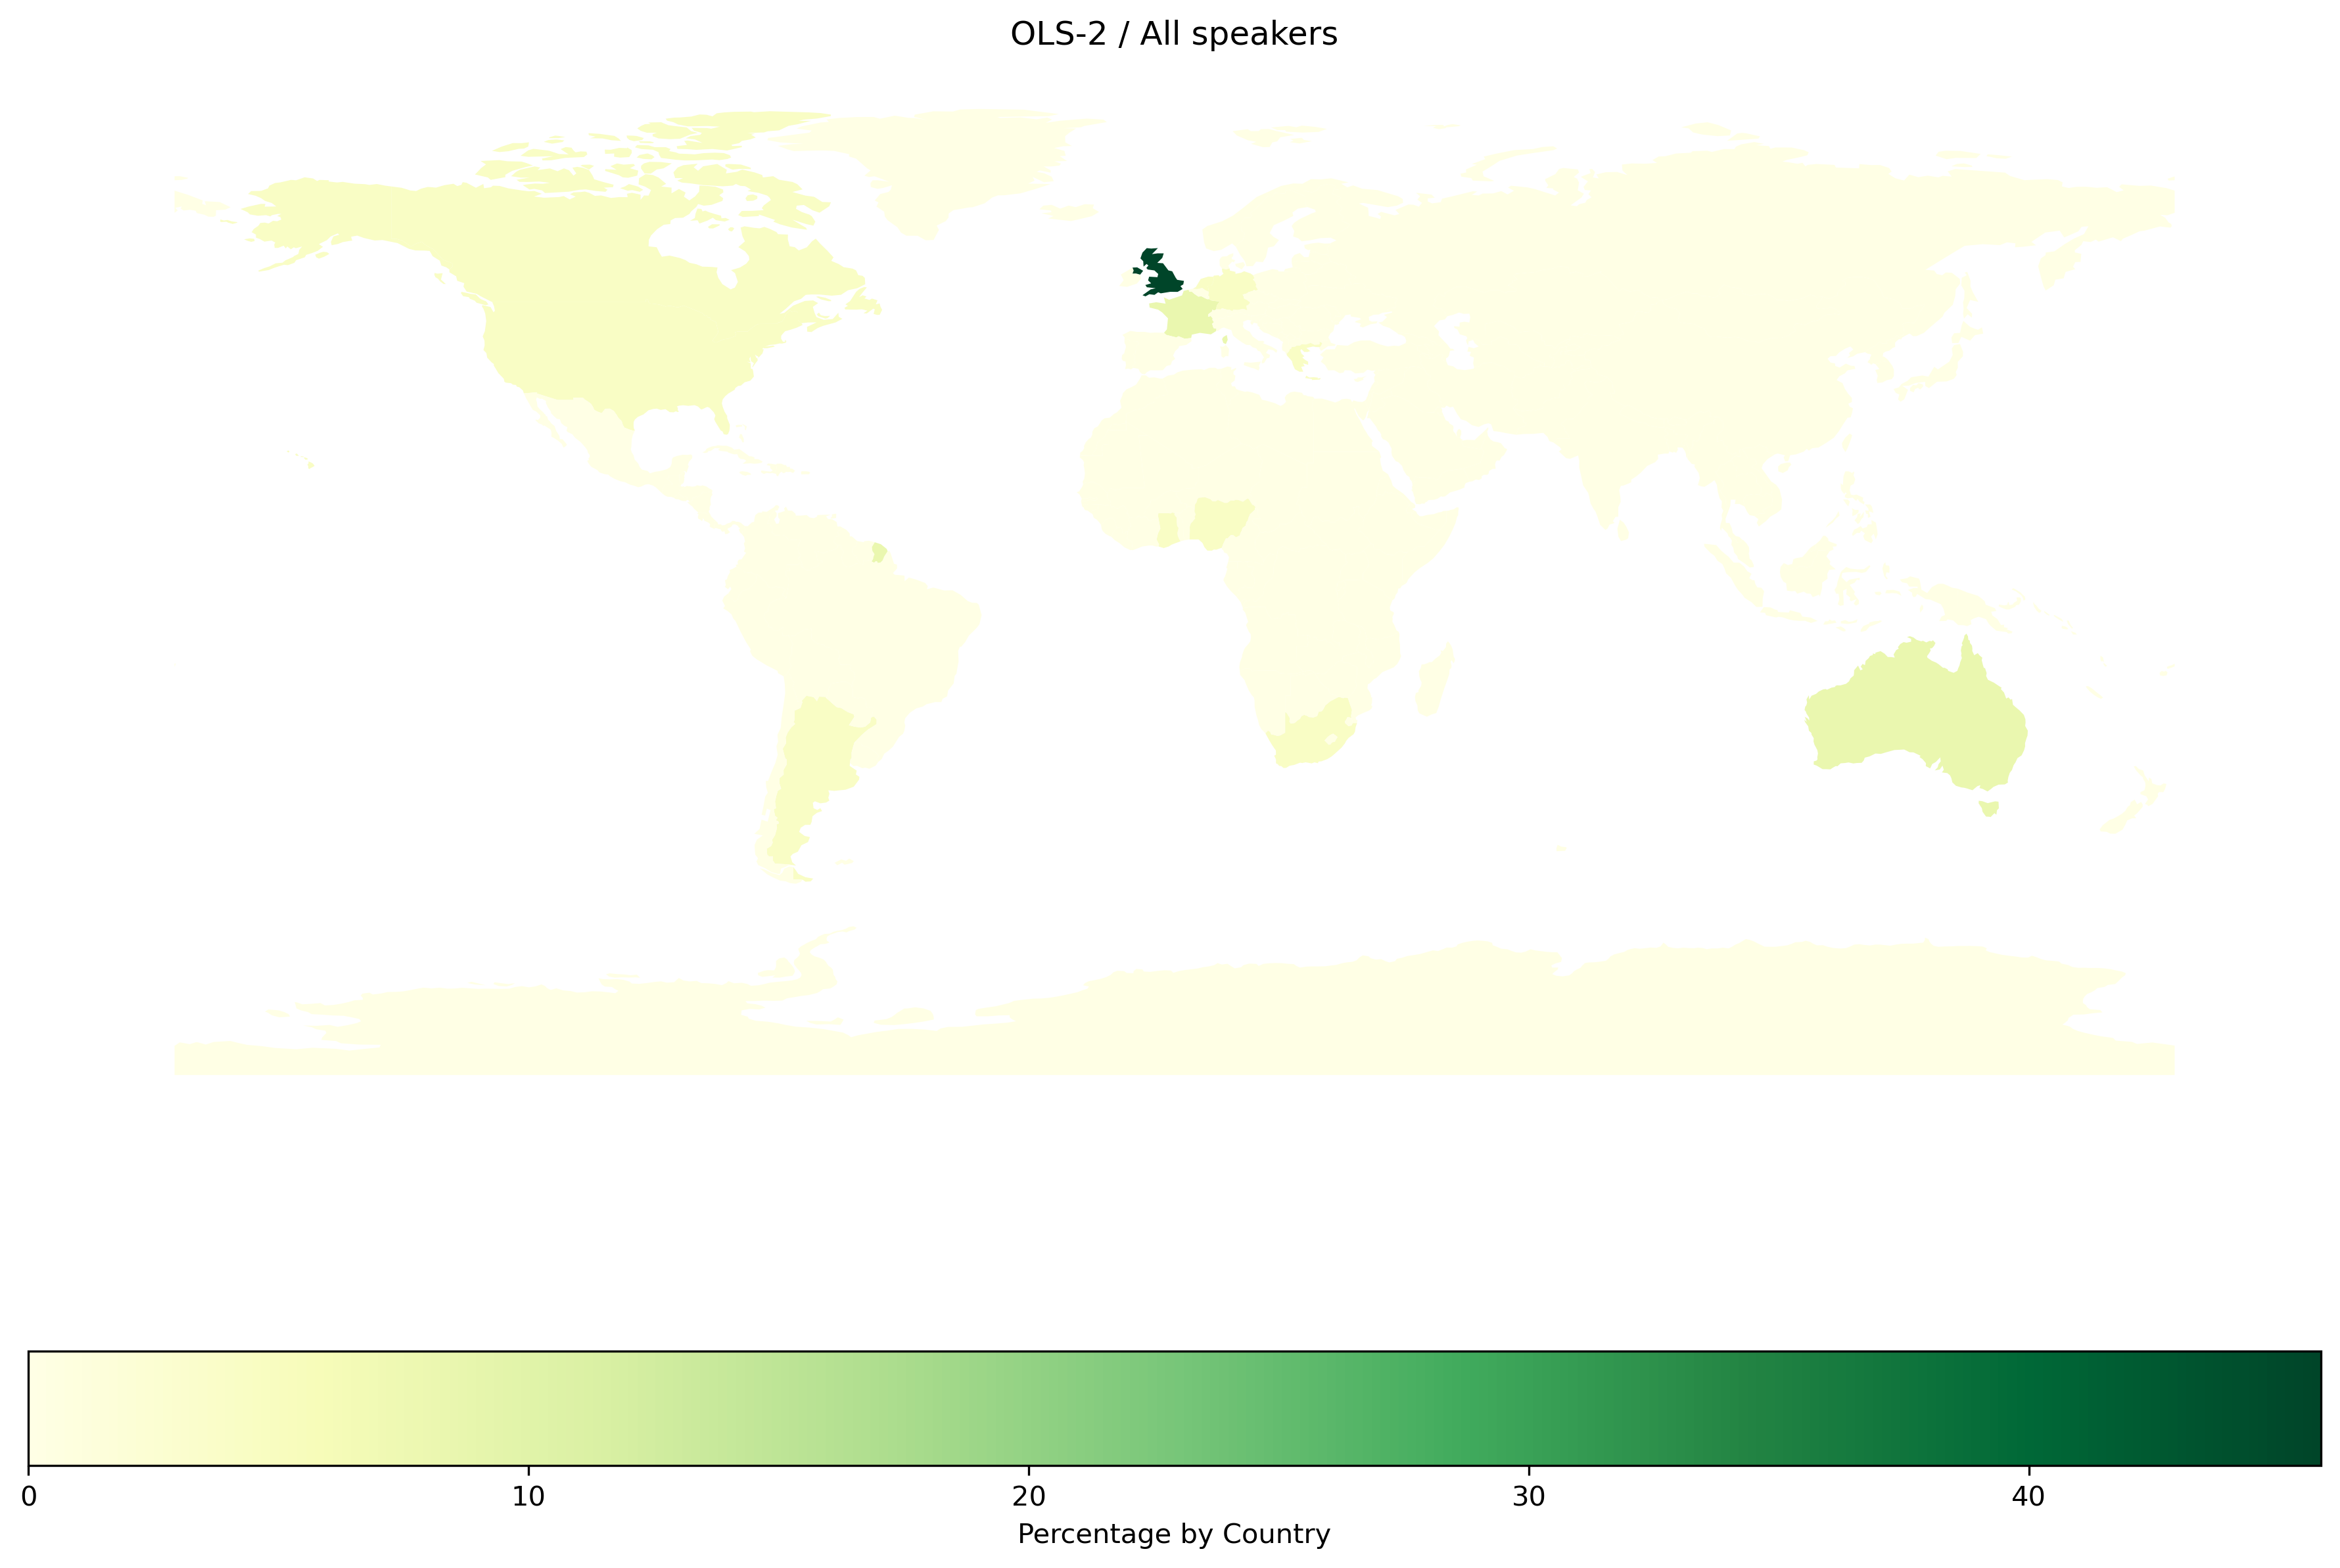
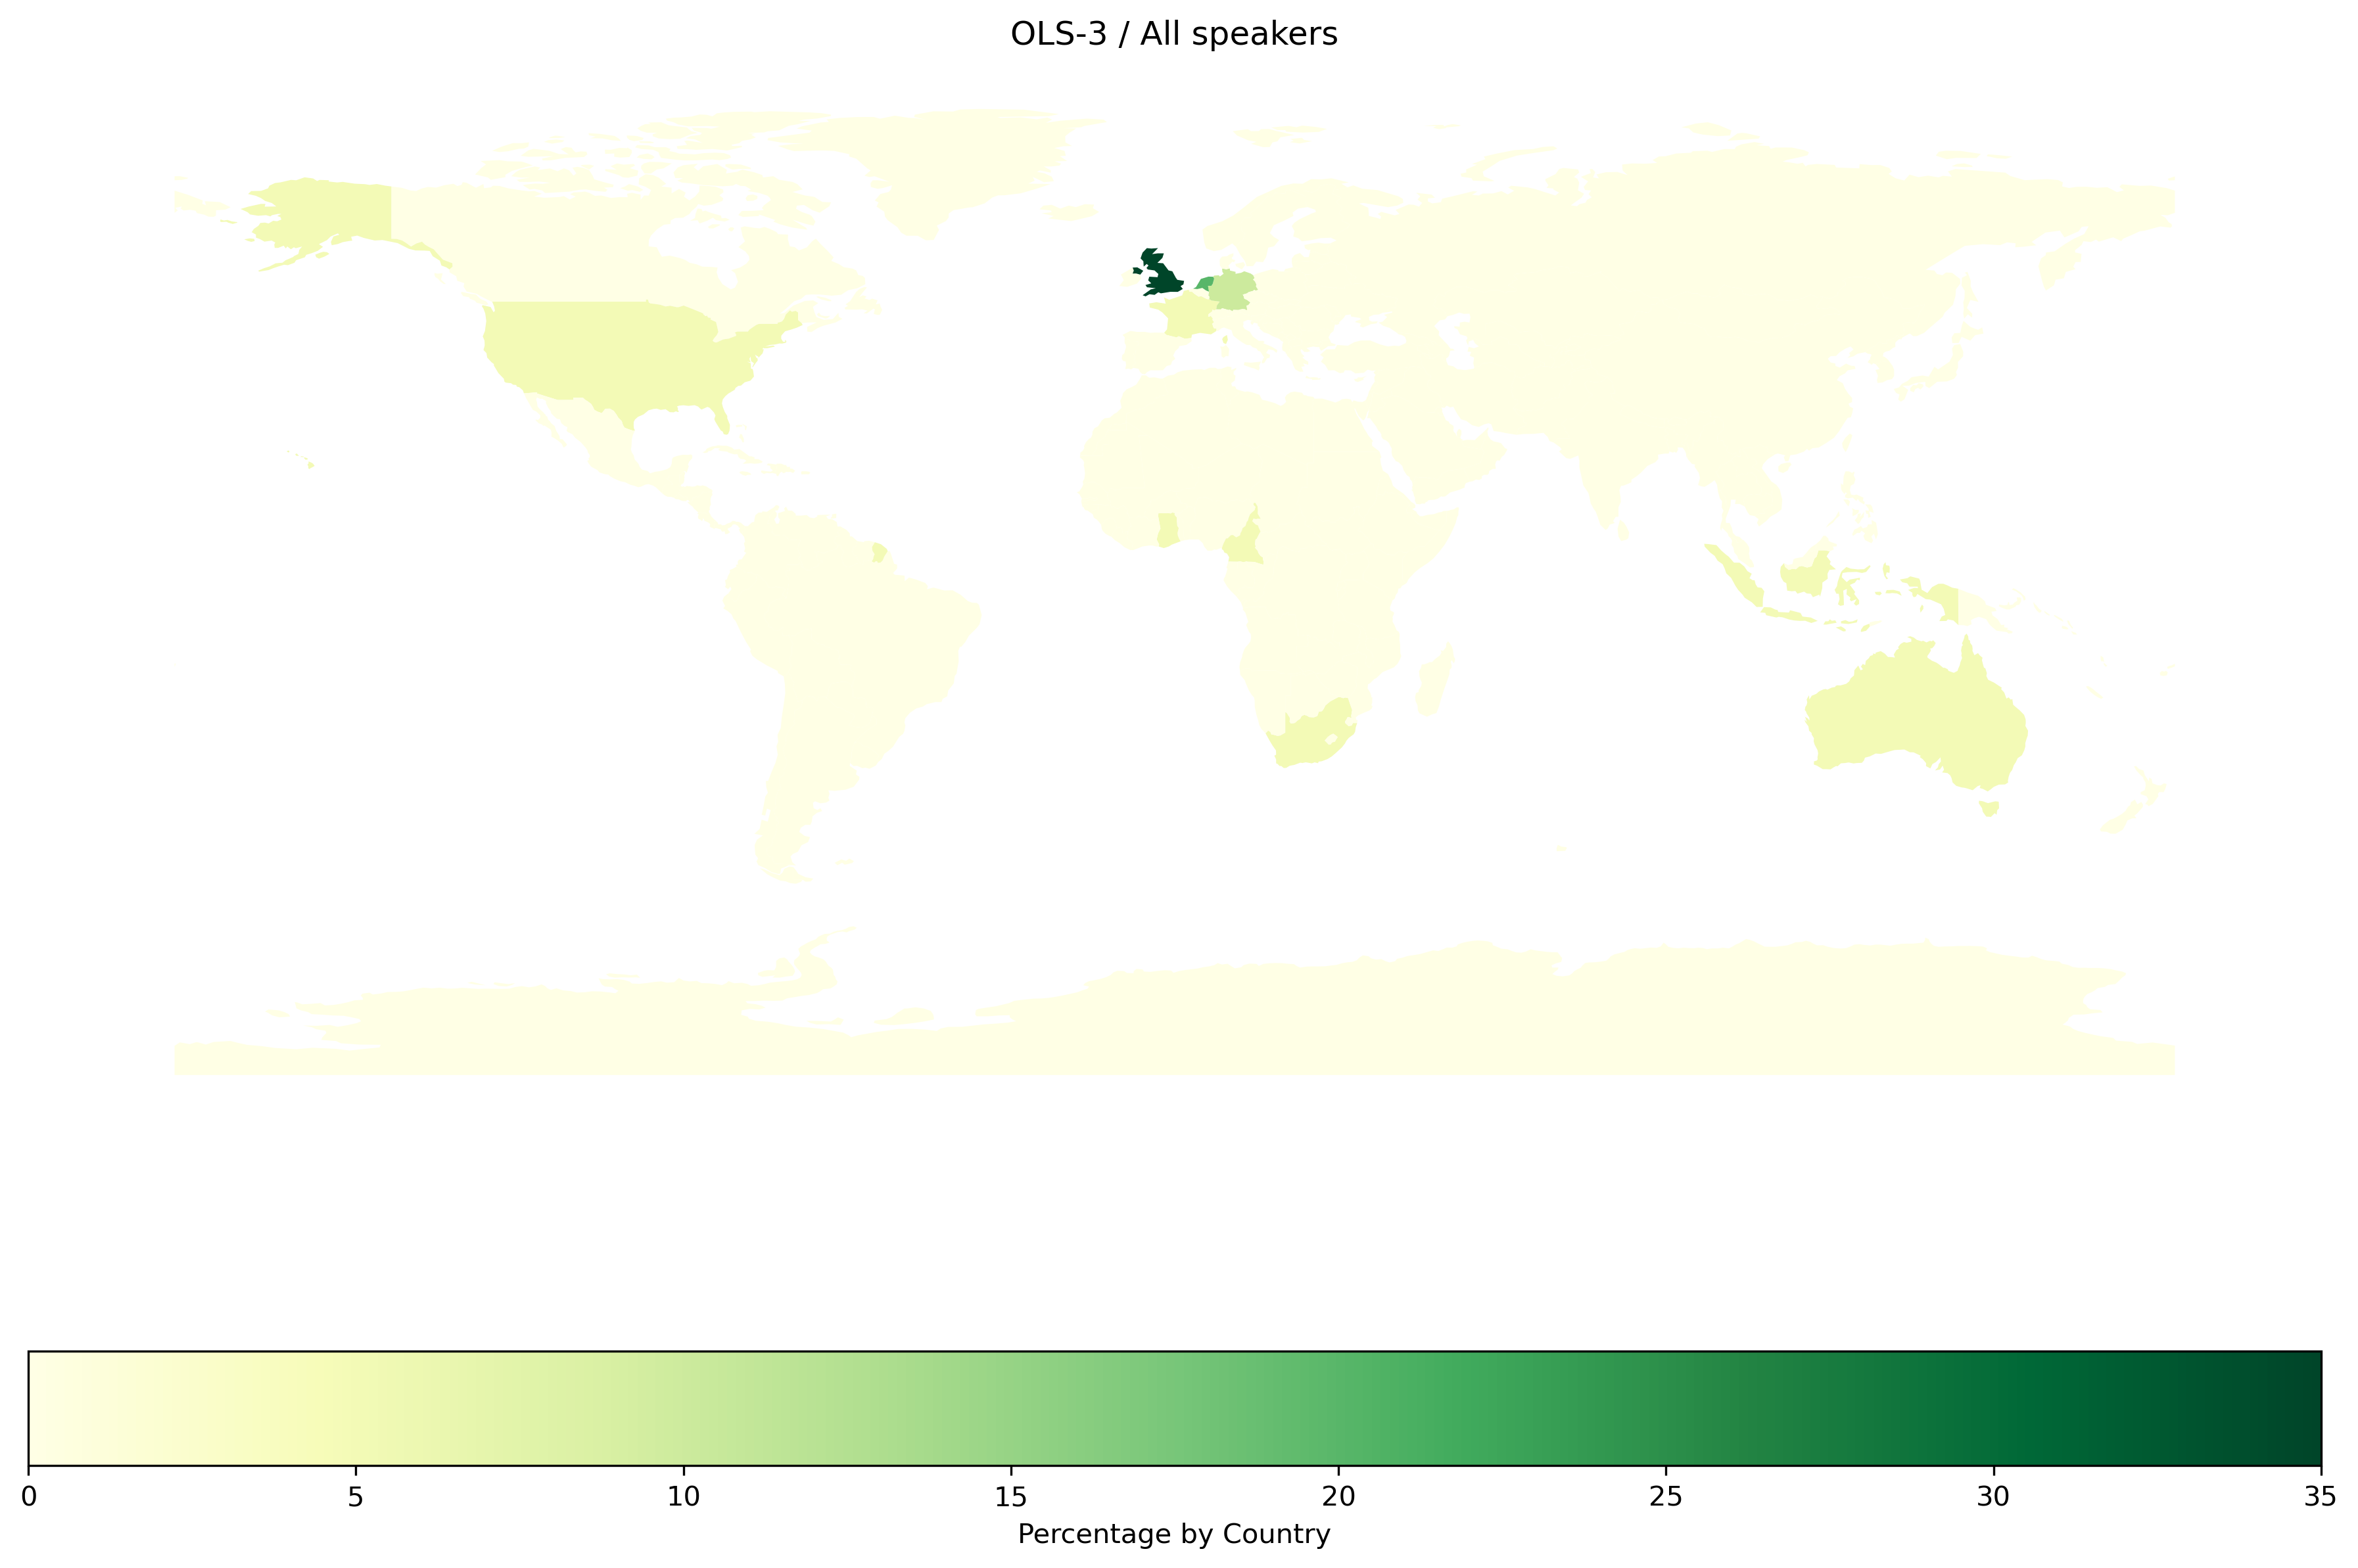
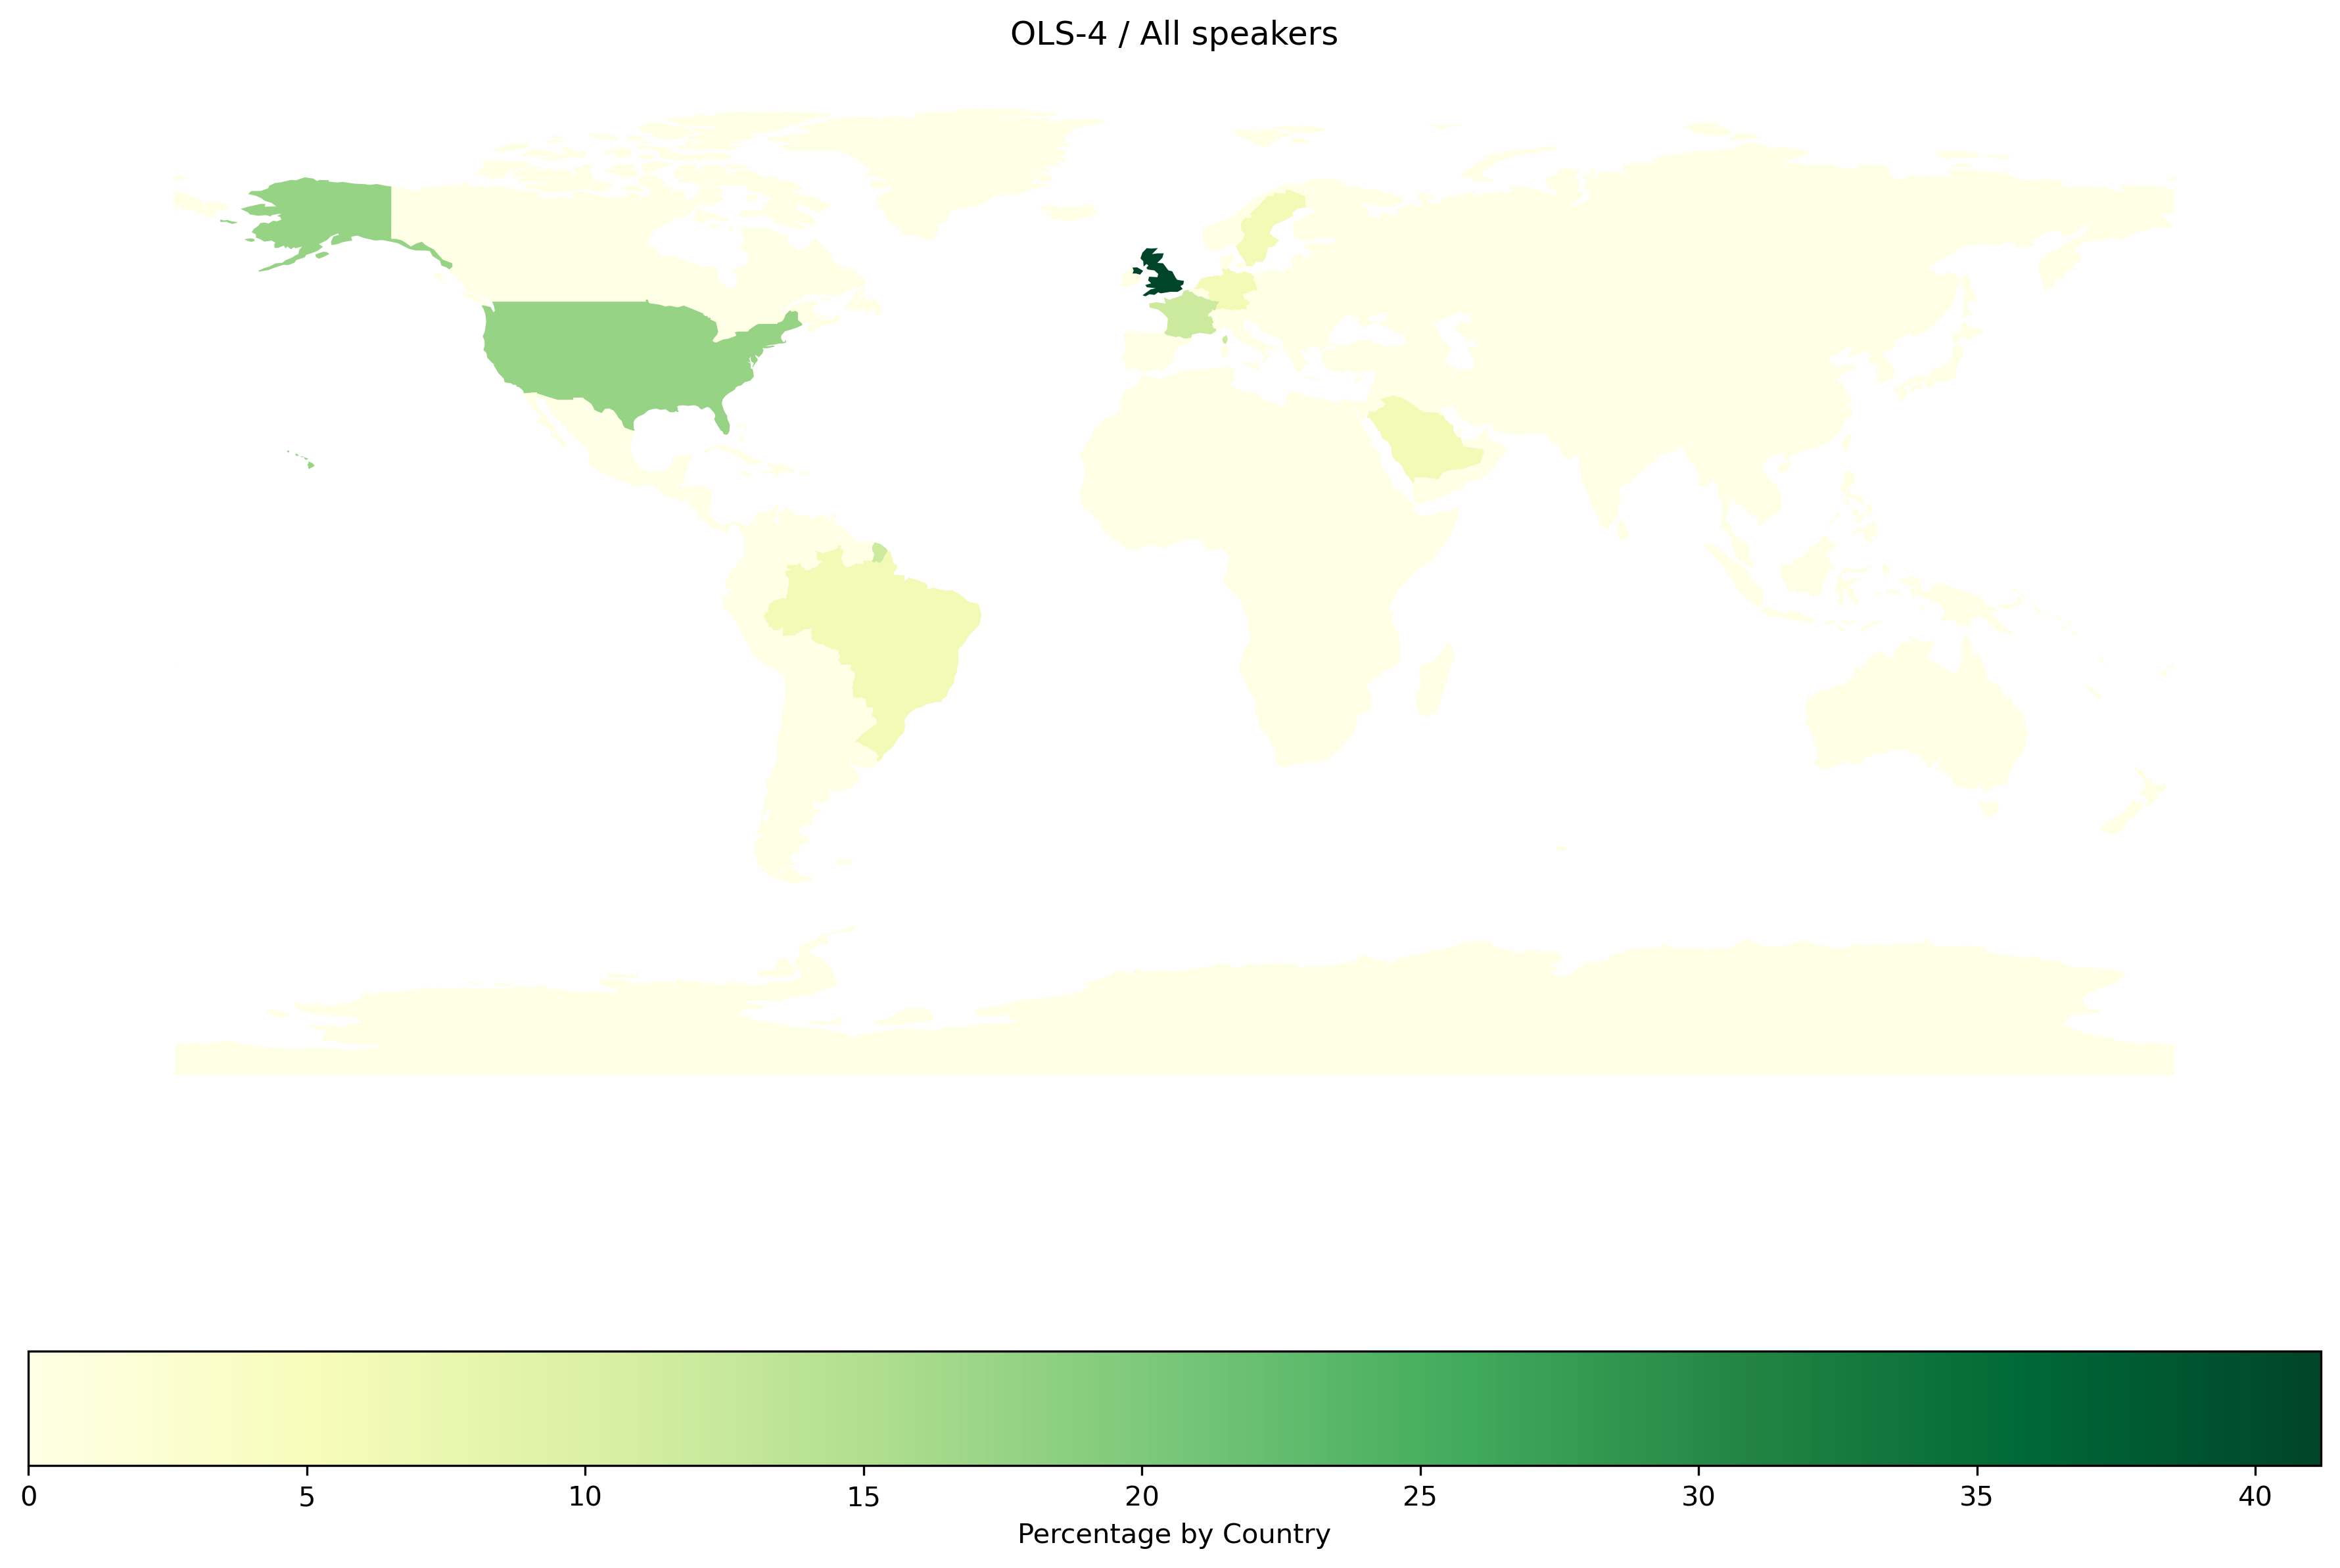
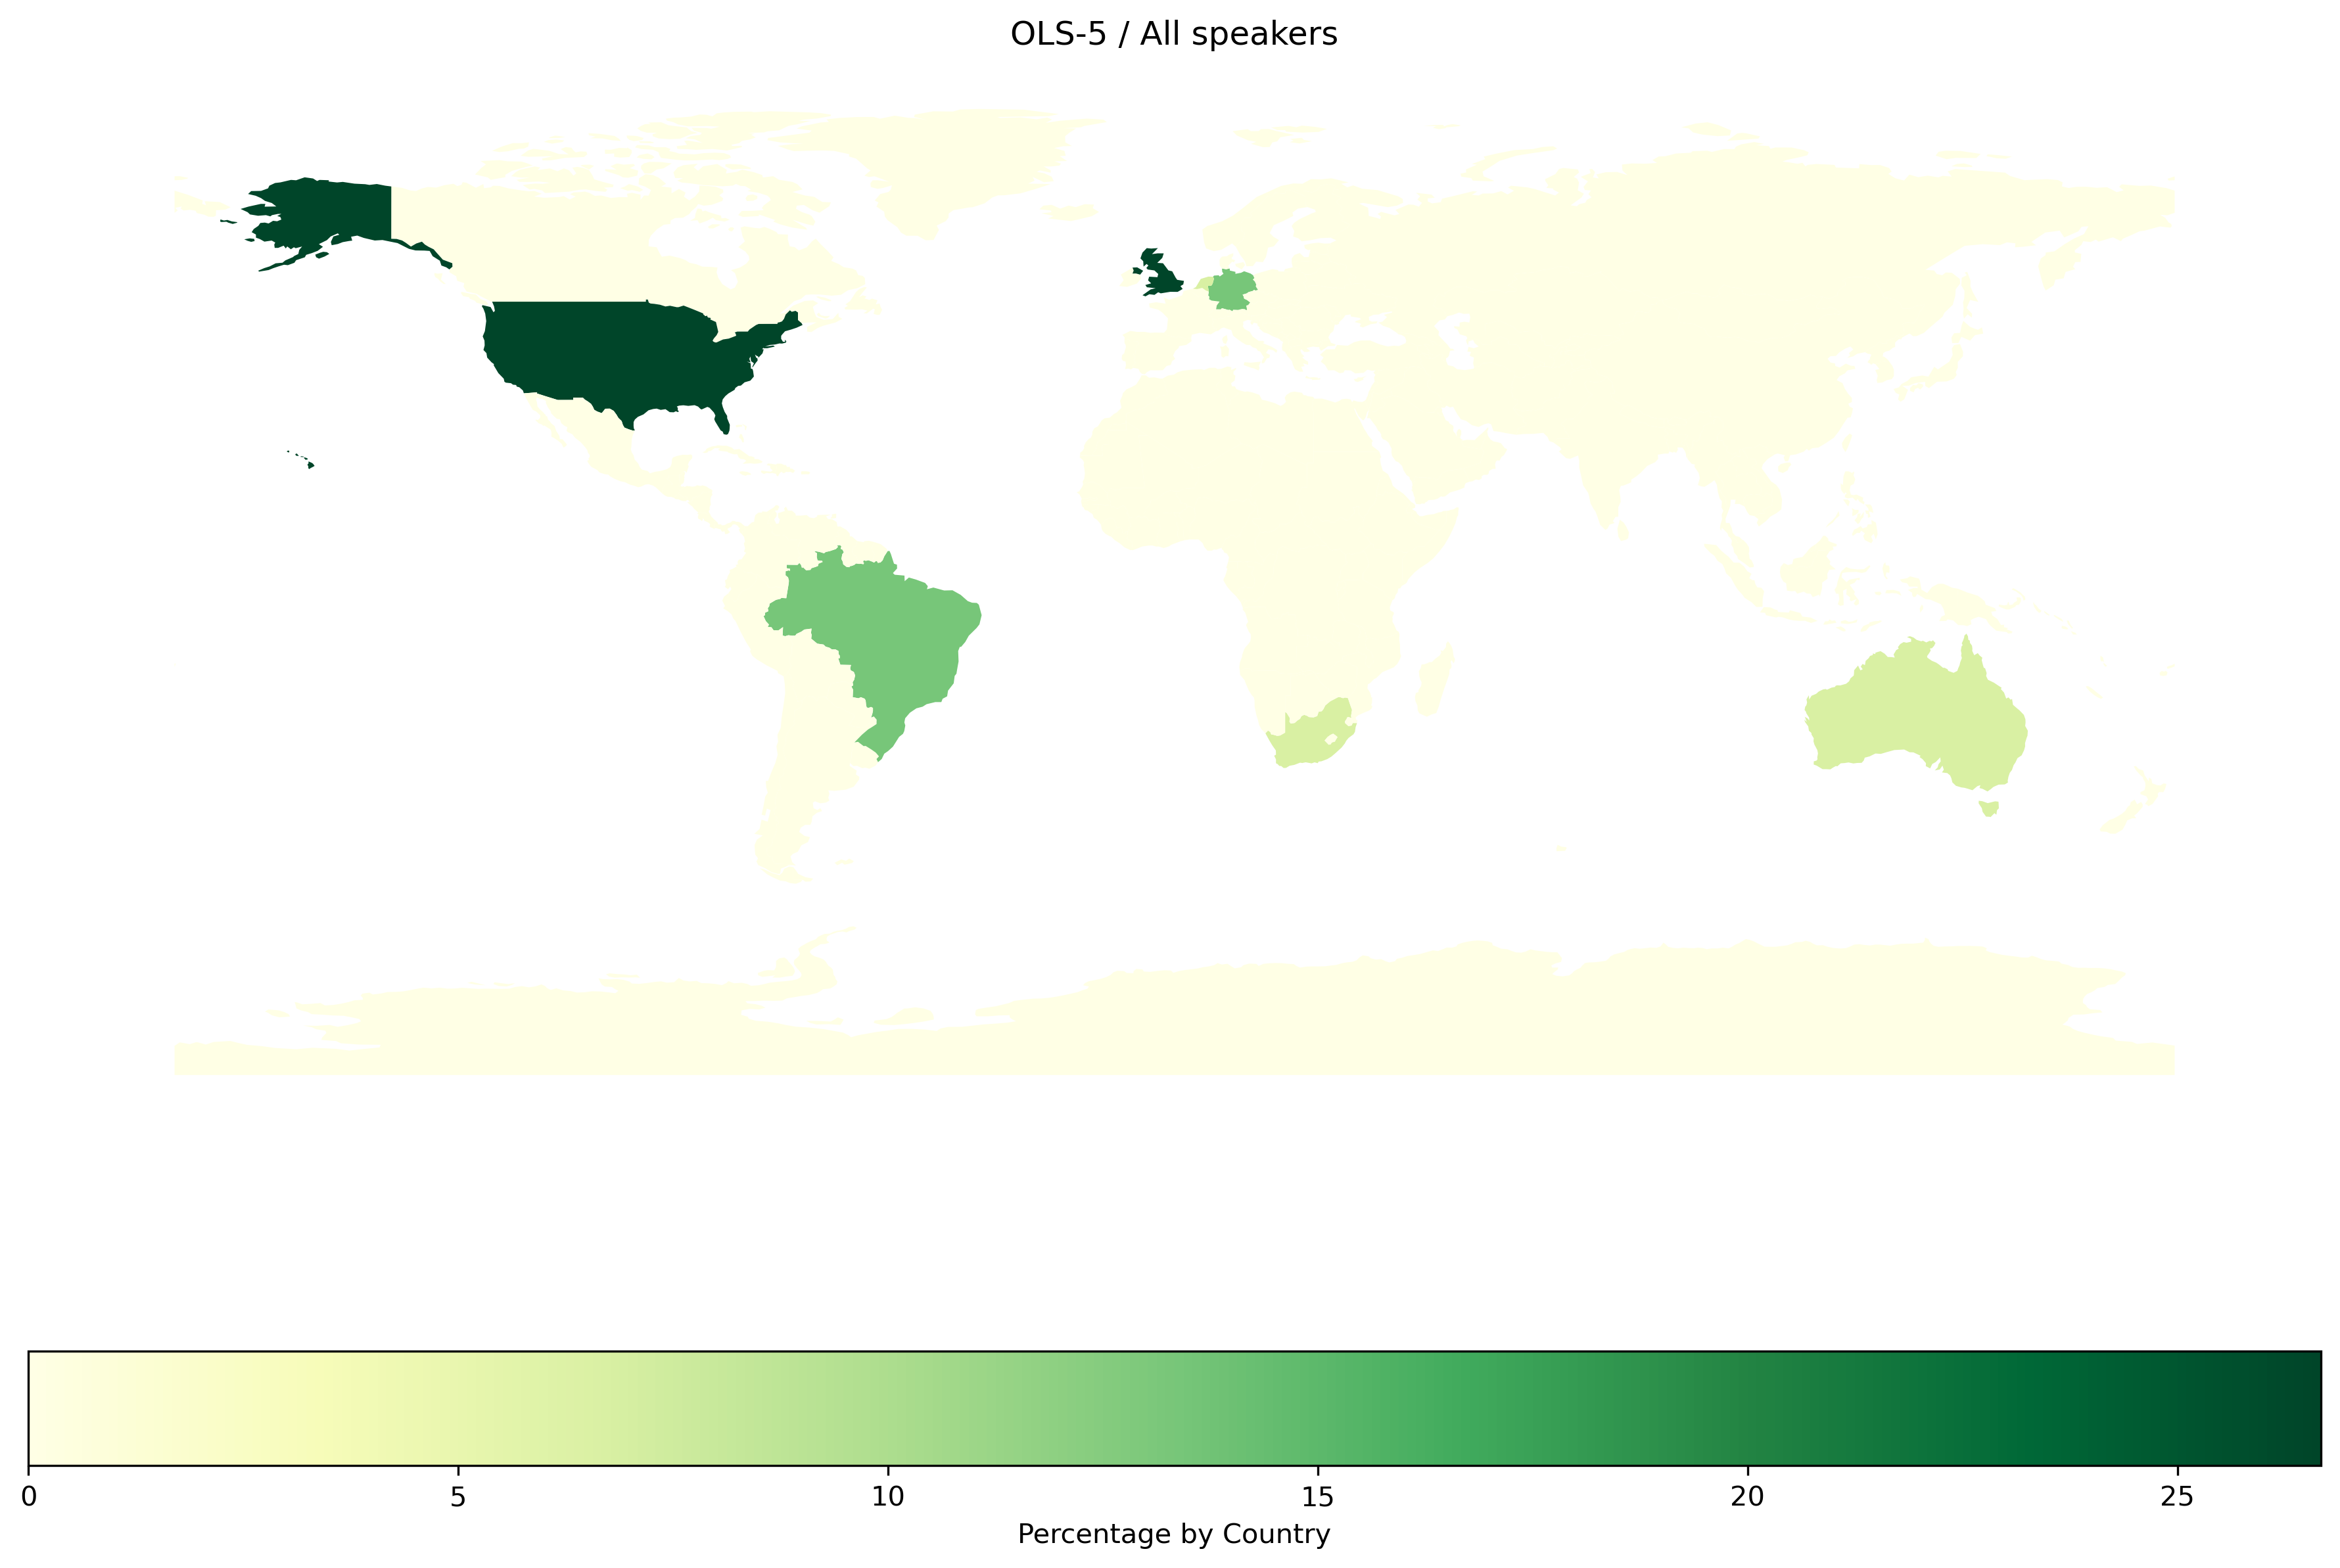
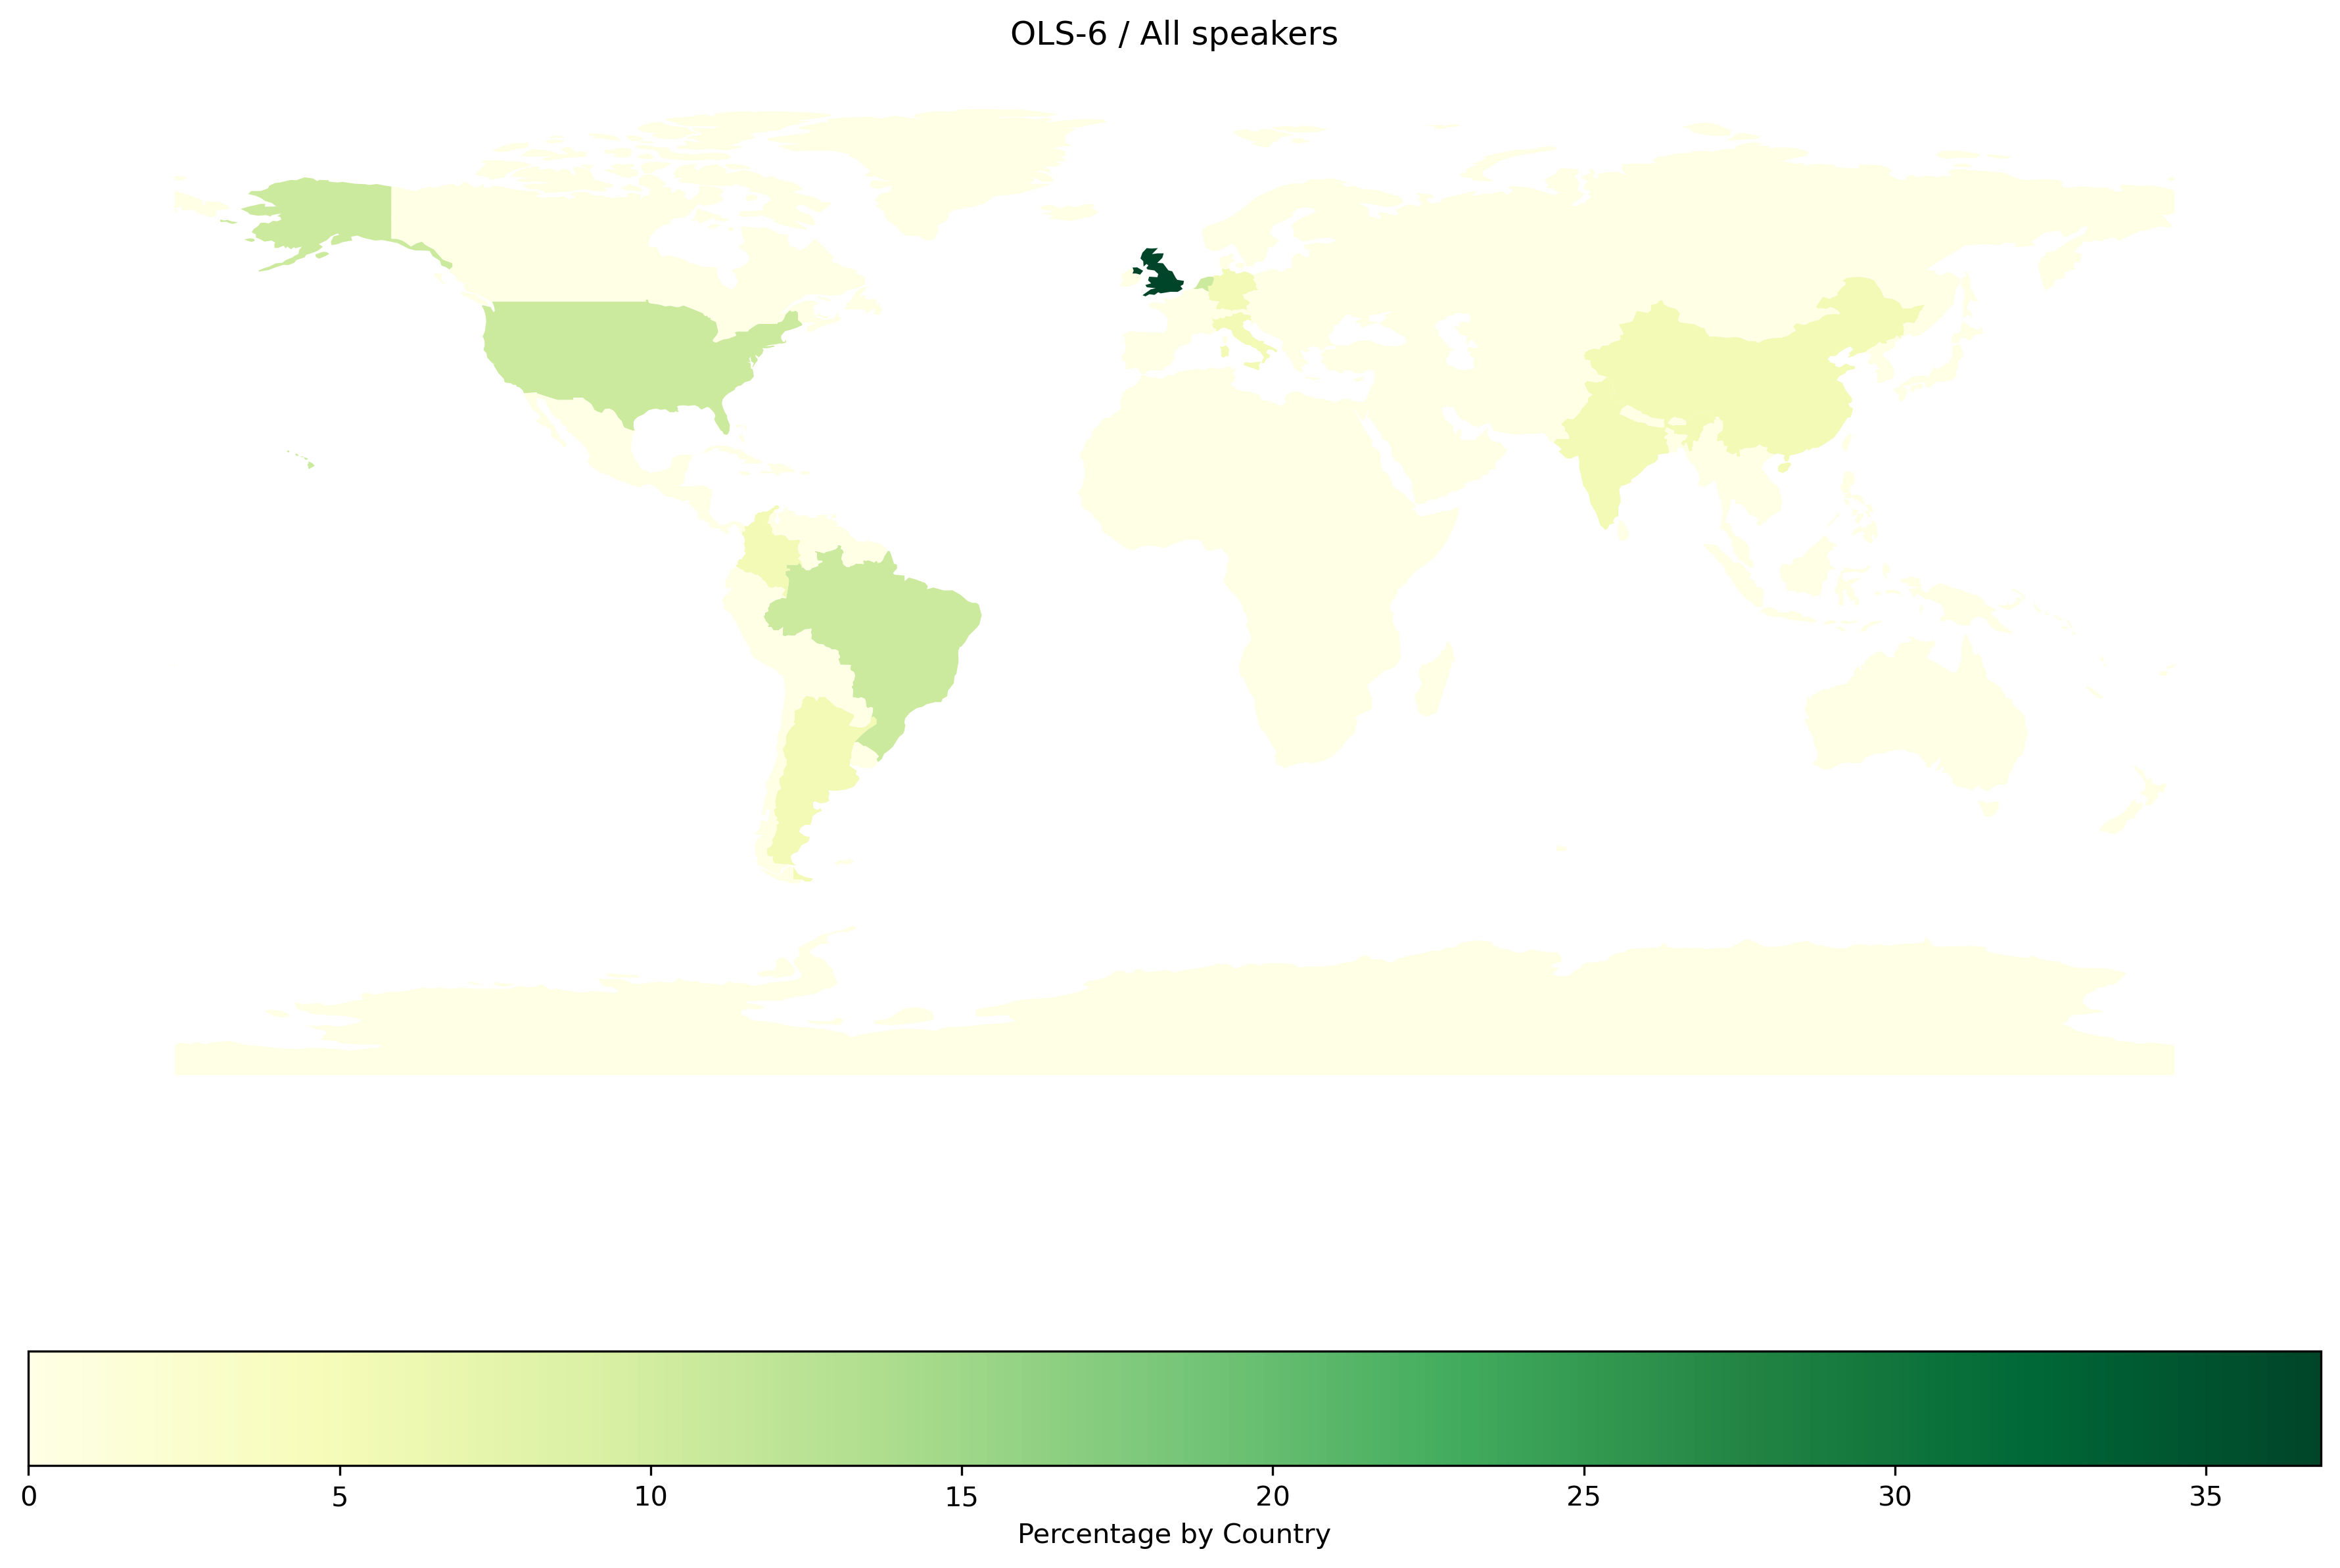
Speakers
|
TOTAL |
OLS-1 |
OLS-2 |
OLS-3 |
OLS-4 |
OLS-5 |
OLS-6 |
OLS-7 |
OLS-8 |
| continent |
|
|
|
|
|
|
|
|
|
| Africa |
10.465116 |
5.555556 |
12.500000 |
15.0 |
0.000000 |
6.666667 |
0.000000 |
14.285714 |
12.5 |
| Asia |
4.651163 |
0.000000 |
0.000000 |
5.0 |
5.882353 |
0.000000 |
10.526316 |
7.142857 |
0.0 |
| Europe |
54.651163 |
66.666667 |
66.666667 |
70.0 |
70.588235 |
46.666667 |
57.894737 |
42.857143 |
75.0 |
| North America |
16.279070 |
27.777778 |
8.333333 |
5.0 |
17.647059 |
26.666667 |
10.526316 |
14.285714 |
12.5 |
| Oceania |
4.651163 |
0.000000 |
8.333333 |
5.0 |
0.000000 |
6.666667 |
0.000000 |
7.142857 |
0.0 |
| South America |
9.302326 |
0.000000 |
4.166667 |
0.0 |
5.882353 |
13.333333 |
21.052632 |
14.285714 |
0.0 |
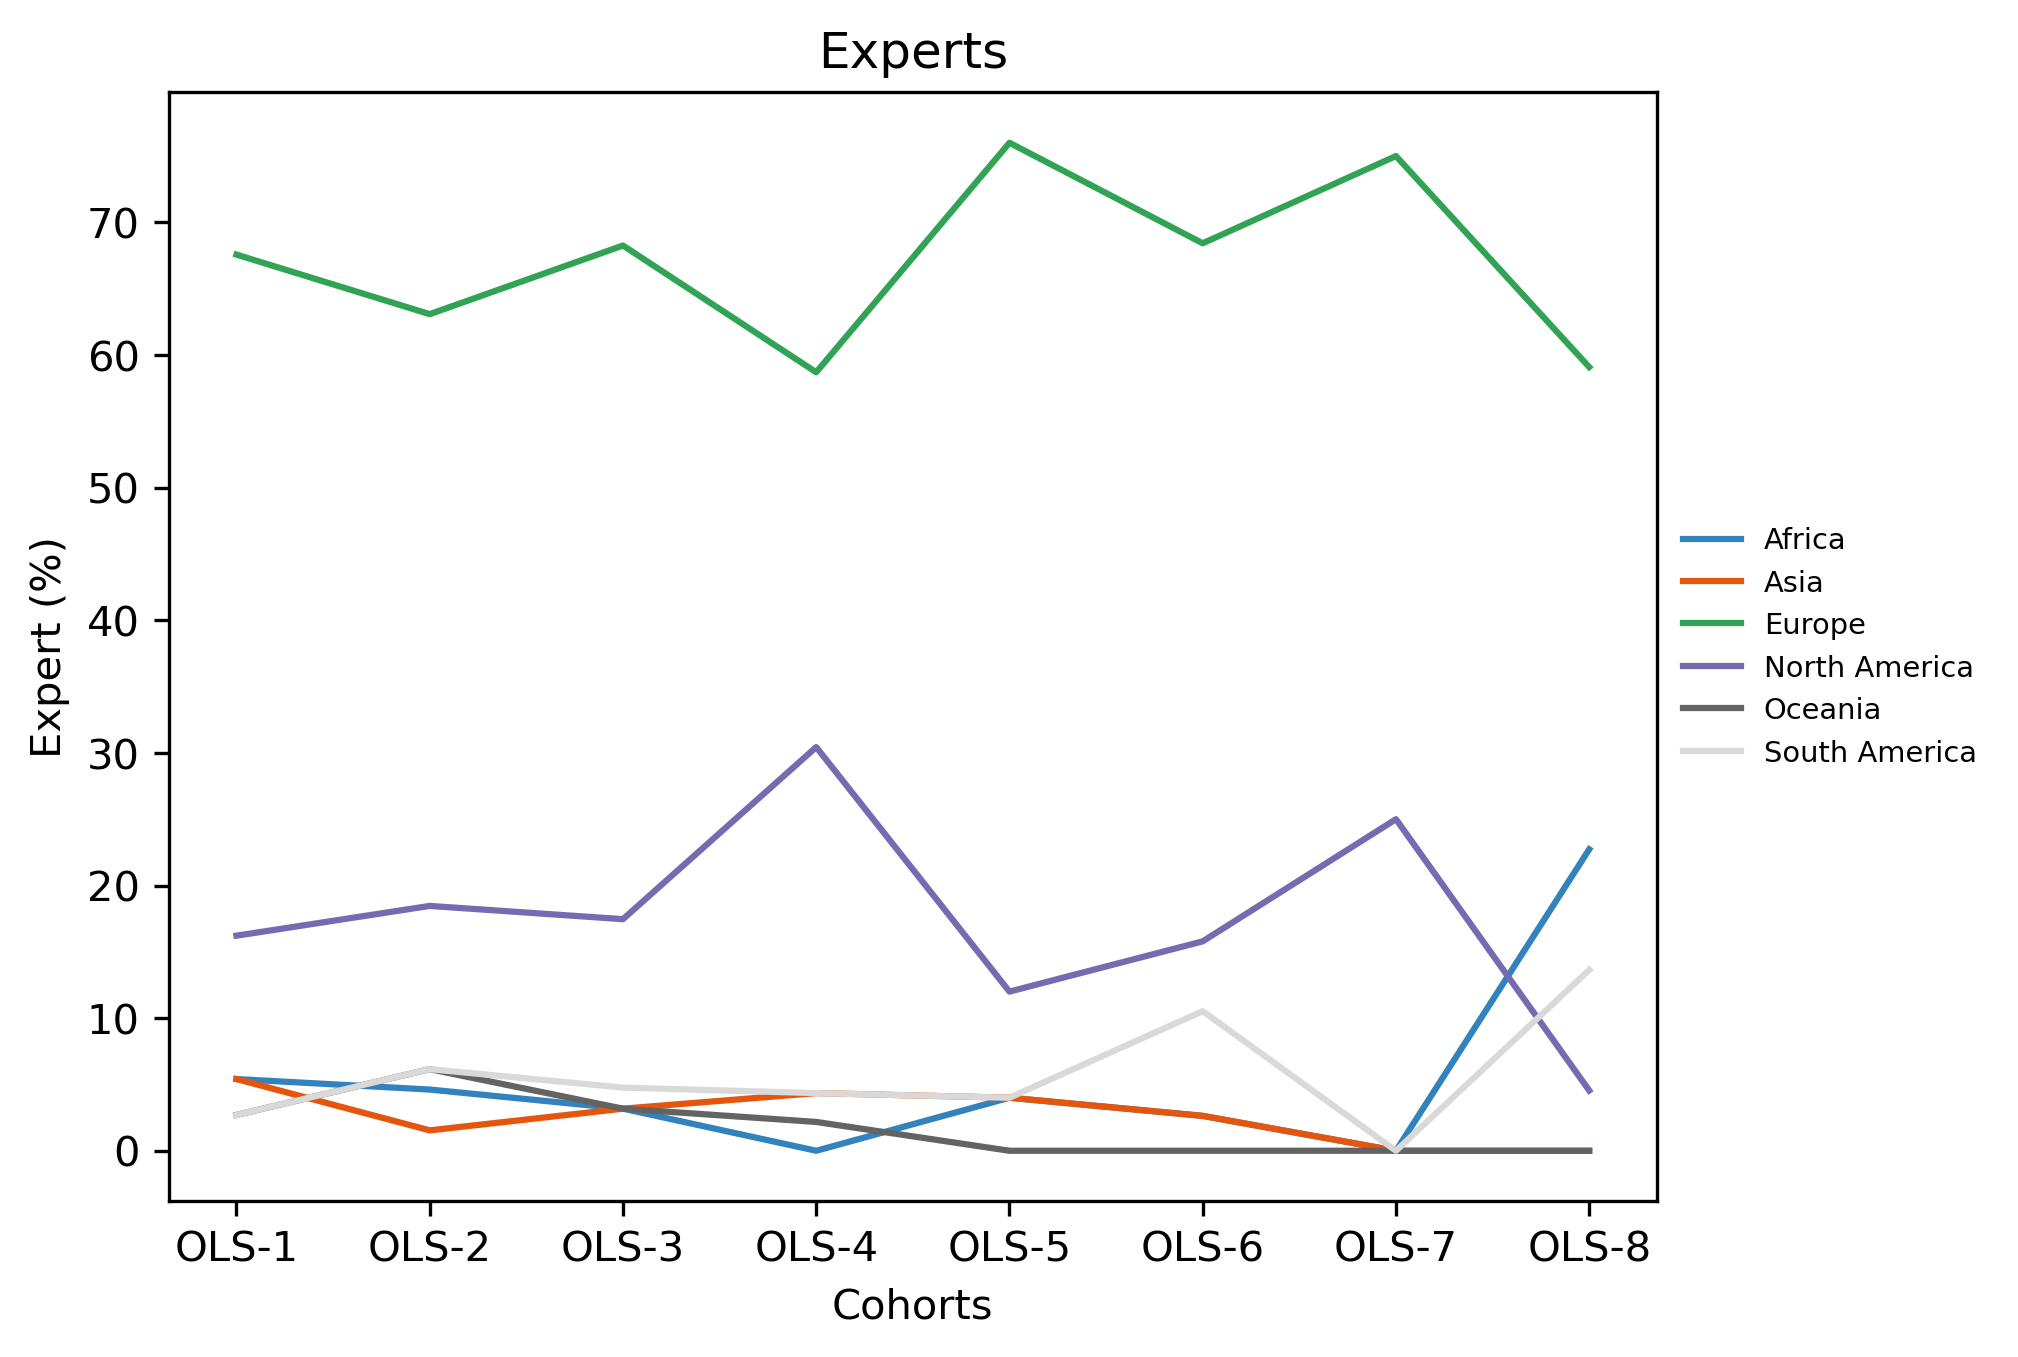
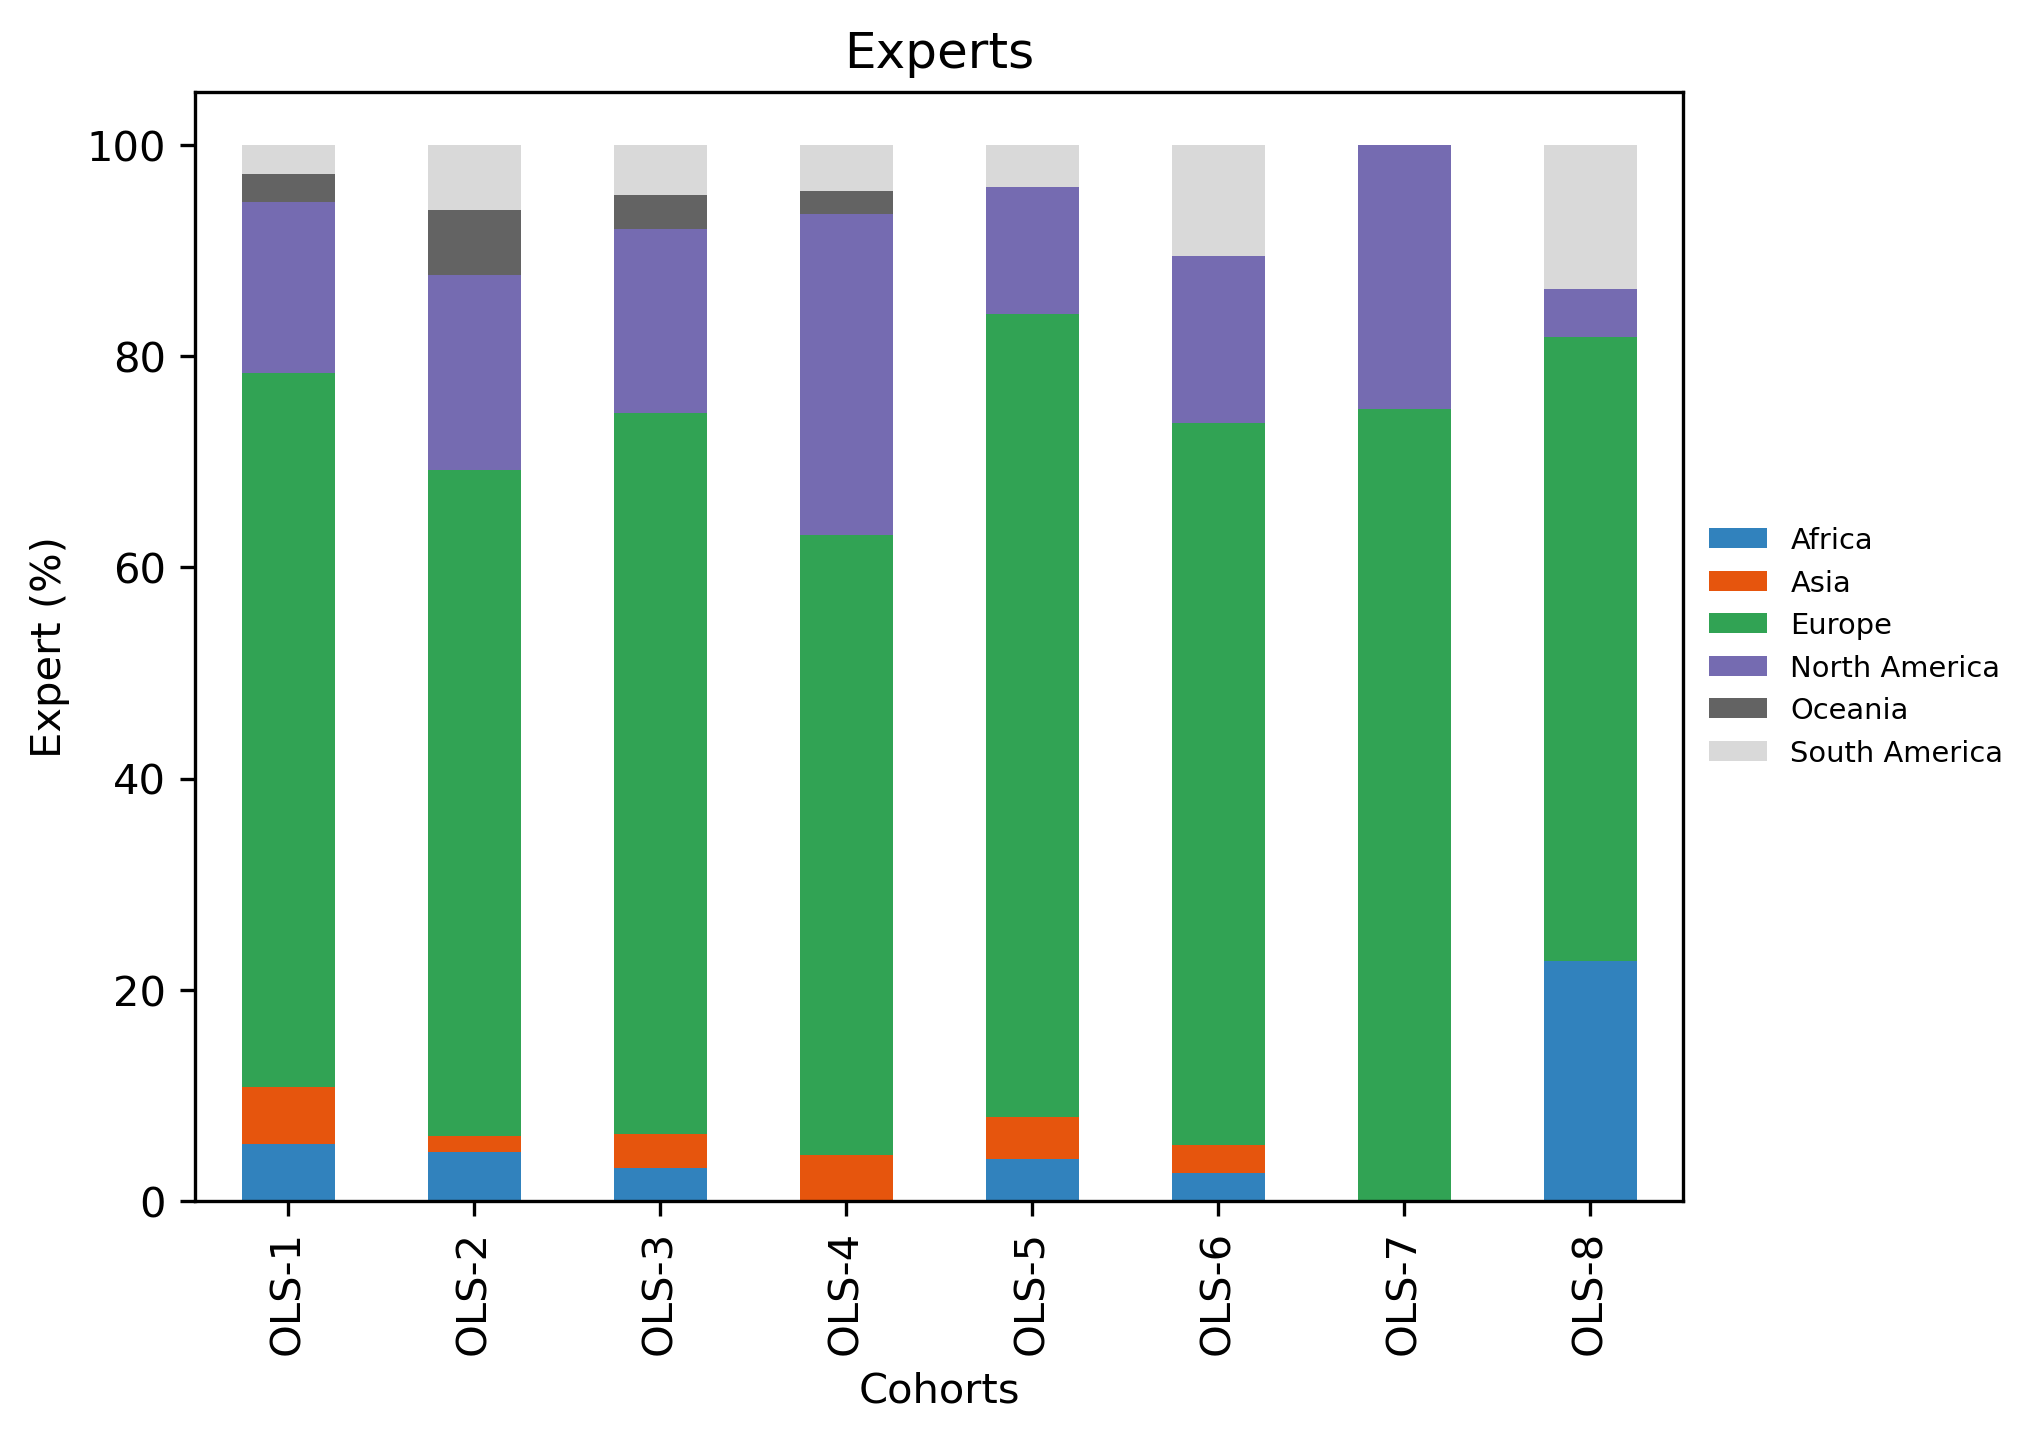
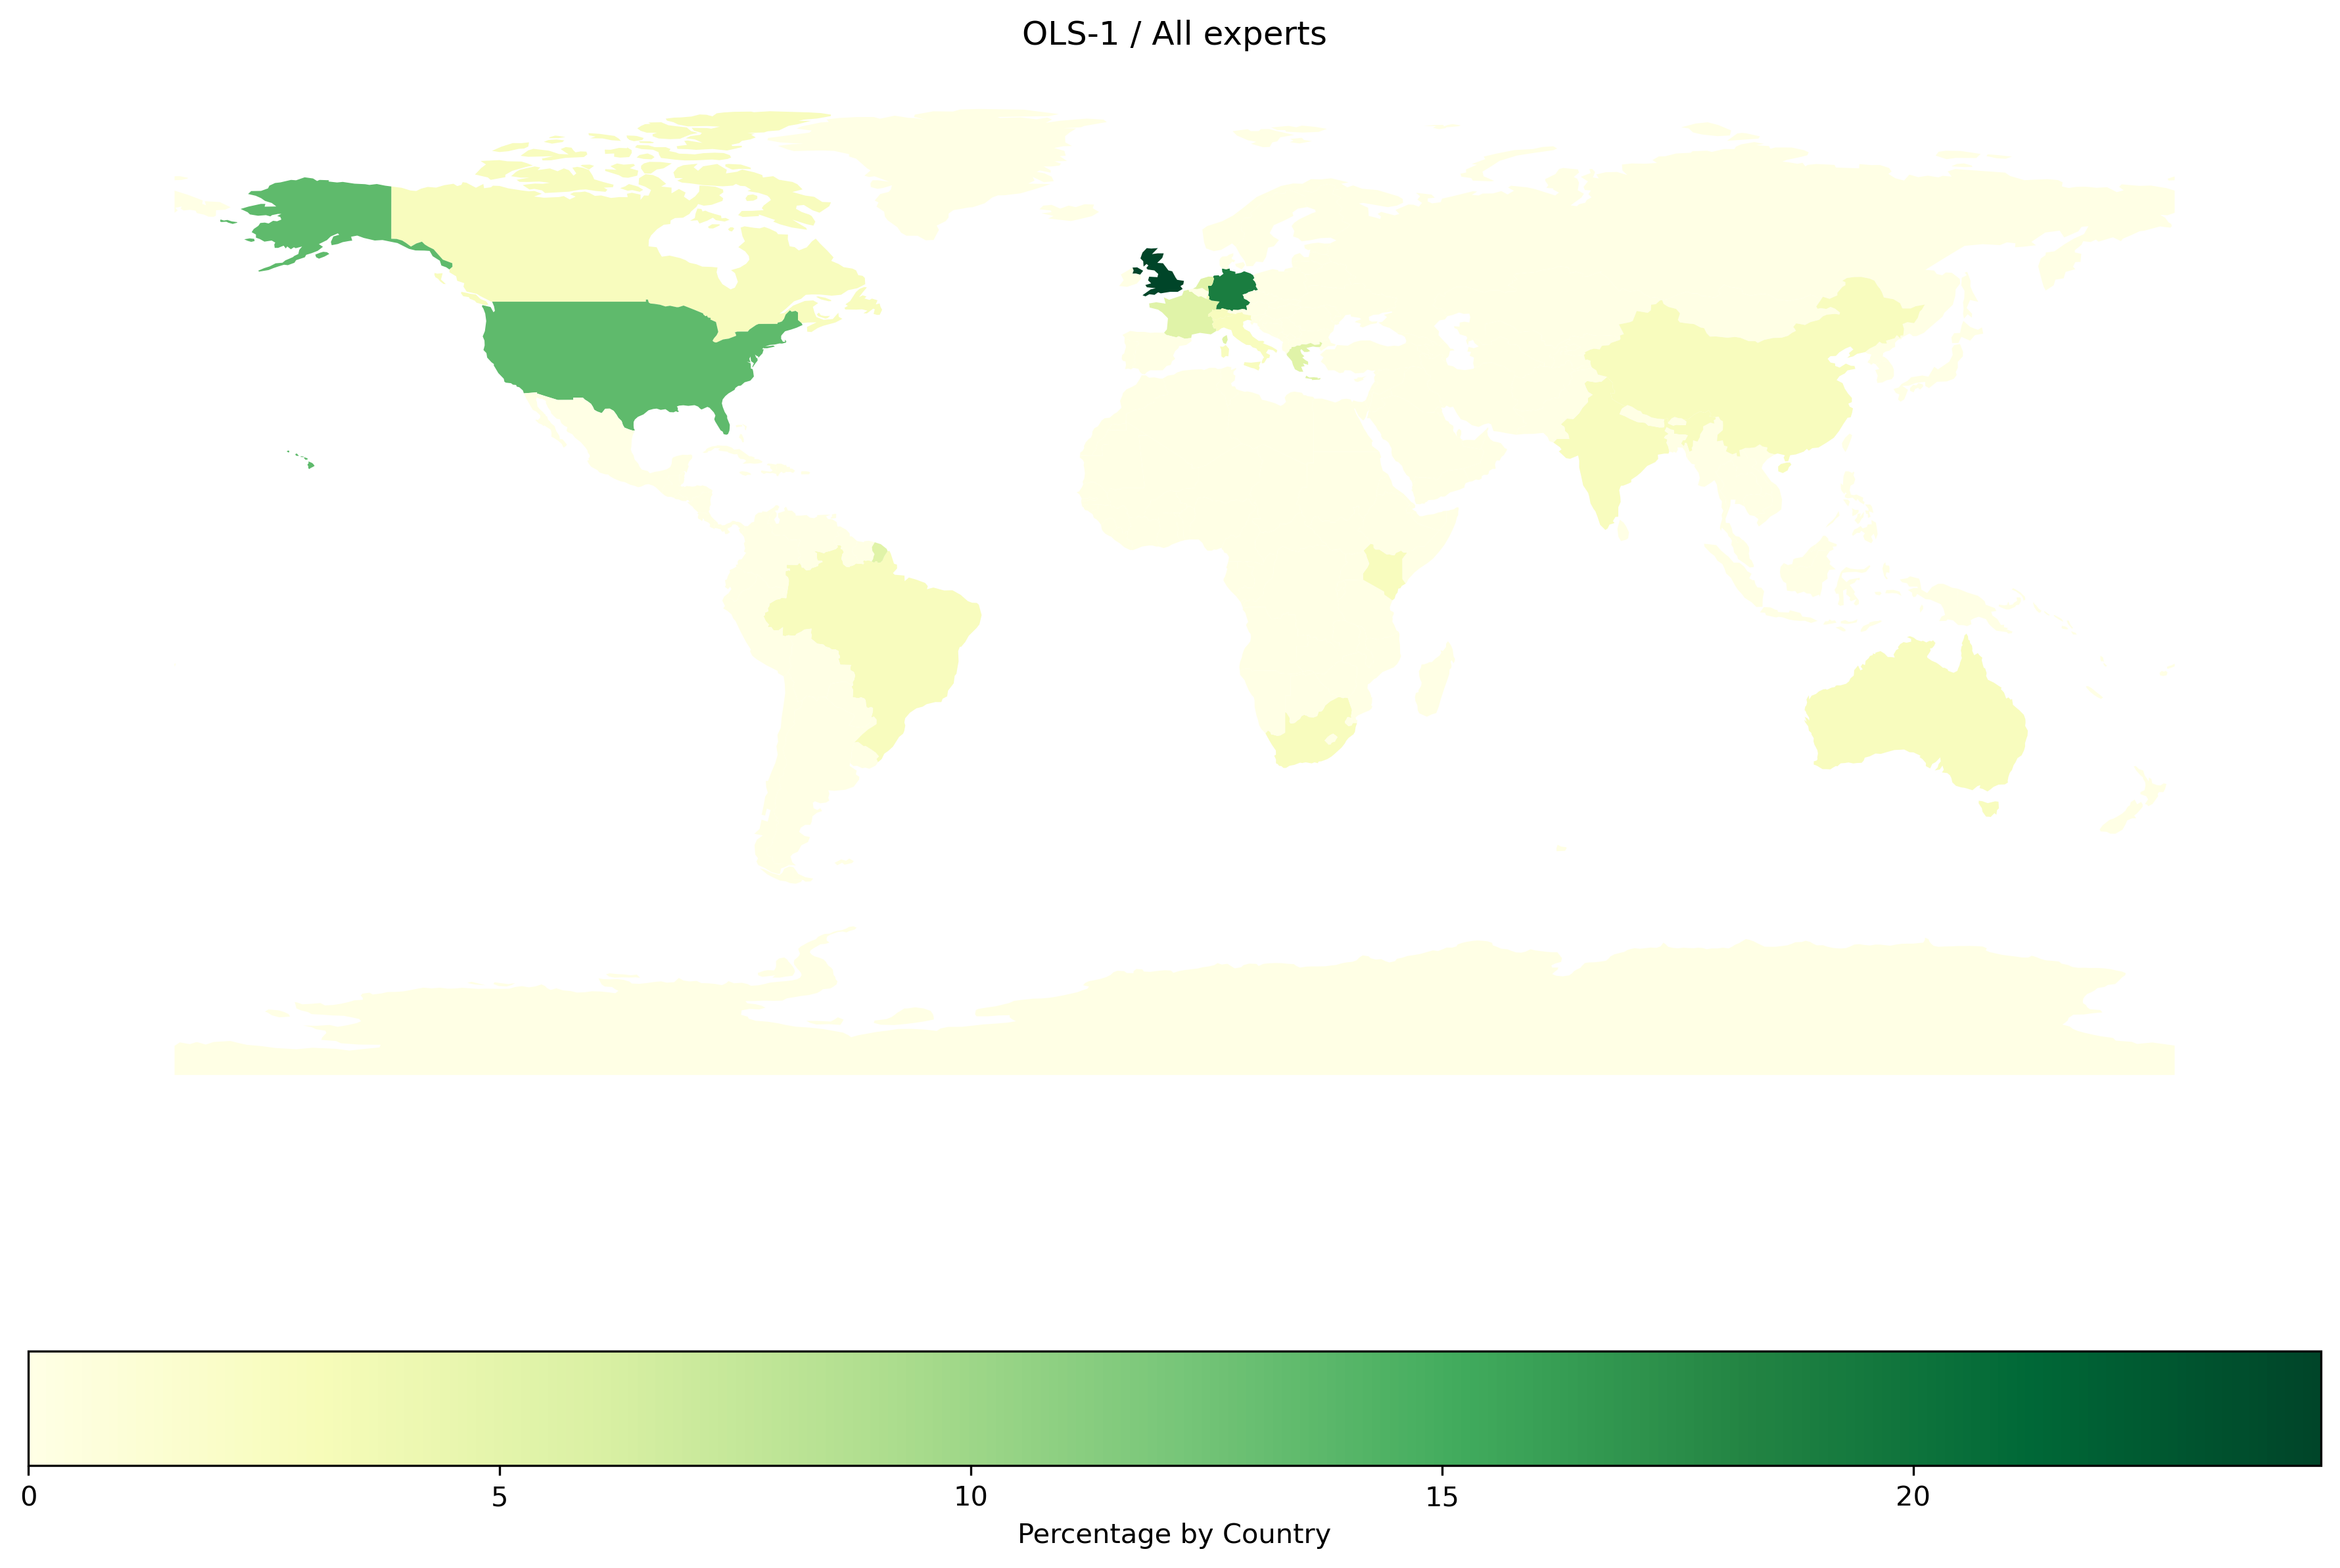
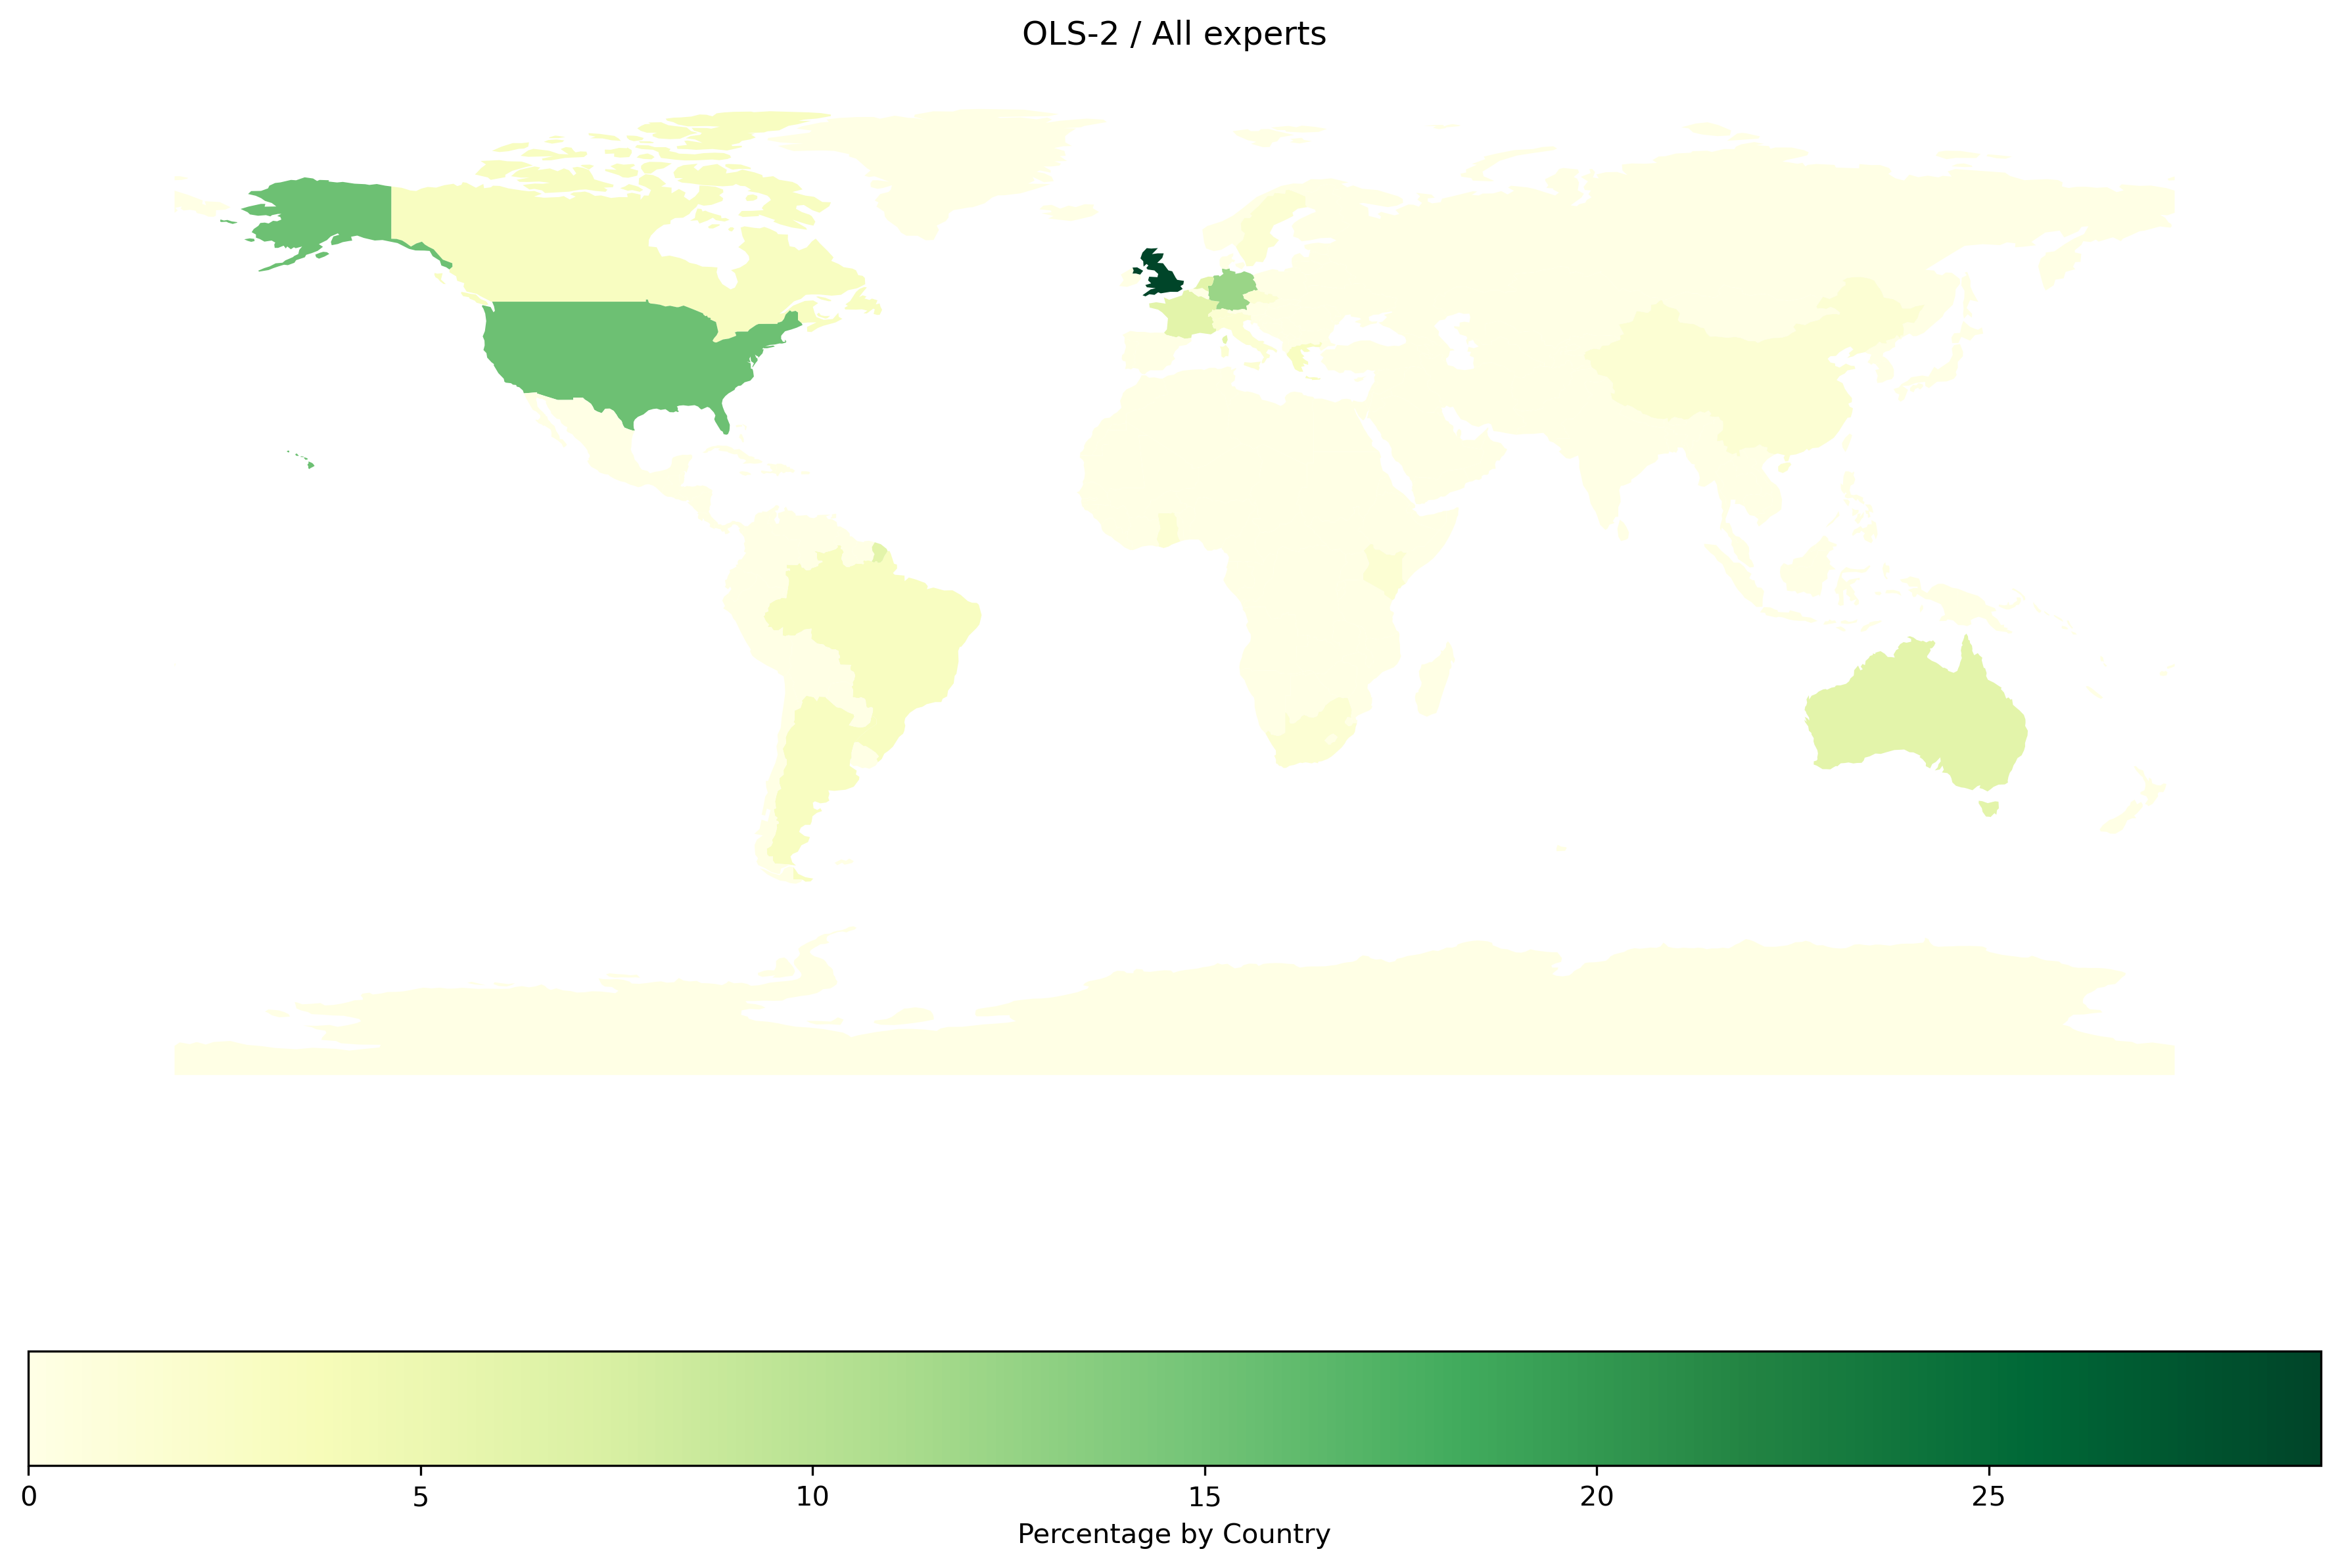
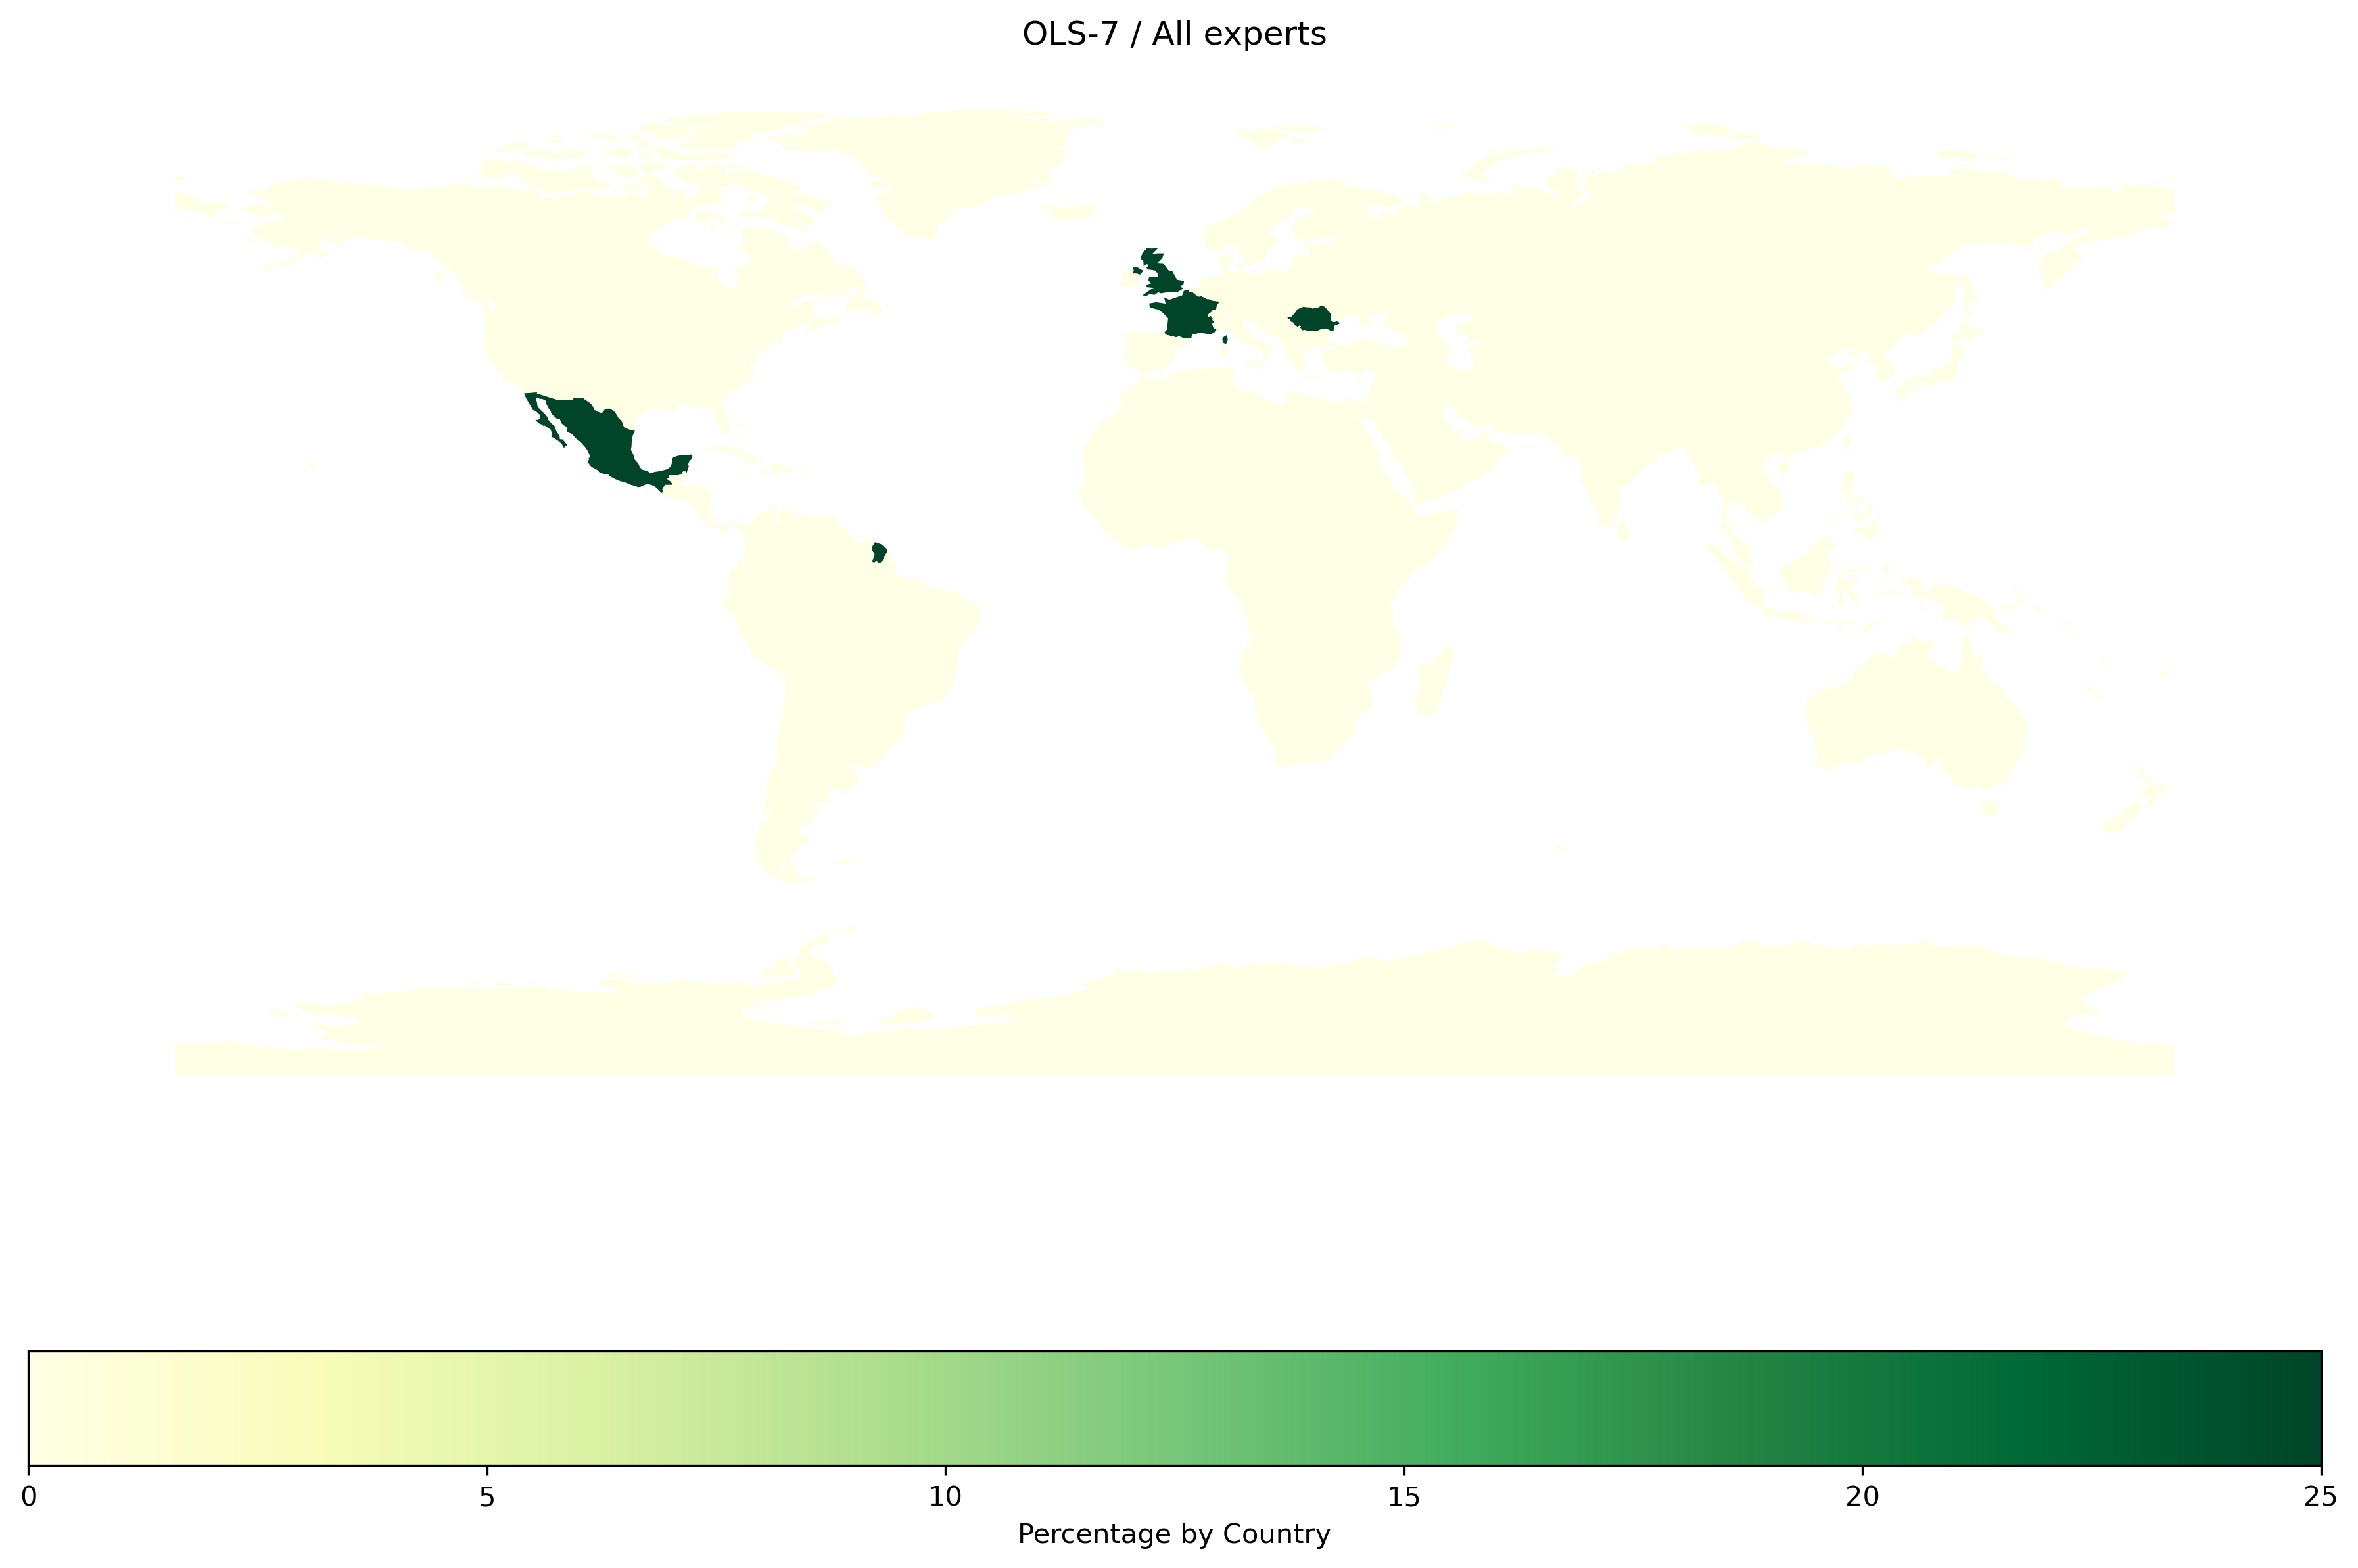
Experts
|
TOTAL |
OLS-1 |
OLS-2 |
OLS-3 |
OLS-4 |
OLS-5 |
OLS-6 |
OLS-7 |
OLS-8 |
| continent |
|
|
|
|
|
|
|
|
|
| Africa |
6.547619 |
5.405405 |
4.615385 |
3.174603 |
0.000000 |
4.0 |
2.631579 |
0.0 |
22.727273 |
| Asia |
4.166667 |
5.405405 |
1.538462 |
3.174603 |
4.347826 |
4.0 |
2.631579 |
0.0 |
0.000000 |
| Europe |
62.500000 |
67.567568 |
63.076923 |
68.253968 |
58.695652 |
76.0 |
68.421053 |
75.0 |
59.090909 |
| North America |
15.476190 |
16.216216 |
18.461538 |
17.460317 |
30.434783 |
12.0 |
15.789474 |
25.0 |
4.545455 |
| Oceania |
2.976190 |
2.702703 |
6.153846 |
3.174603 |
2.173913 |
0.0 |
0.000000 |
0.0 |
0.000000 |
| South America |
8.333333 |
2.702703 |
6.153846 |
4.761905 |
4.347826 |
4.0 |
10.526316 |
0.0 |
13.636364 |
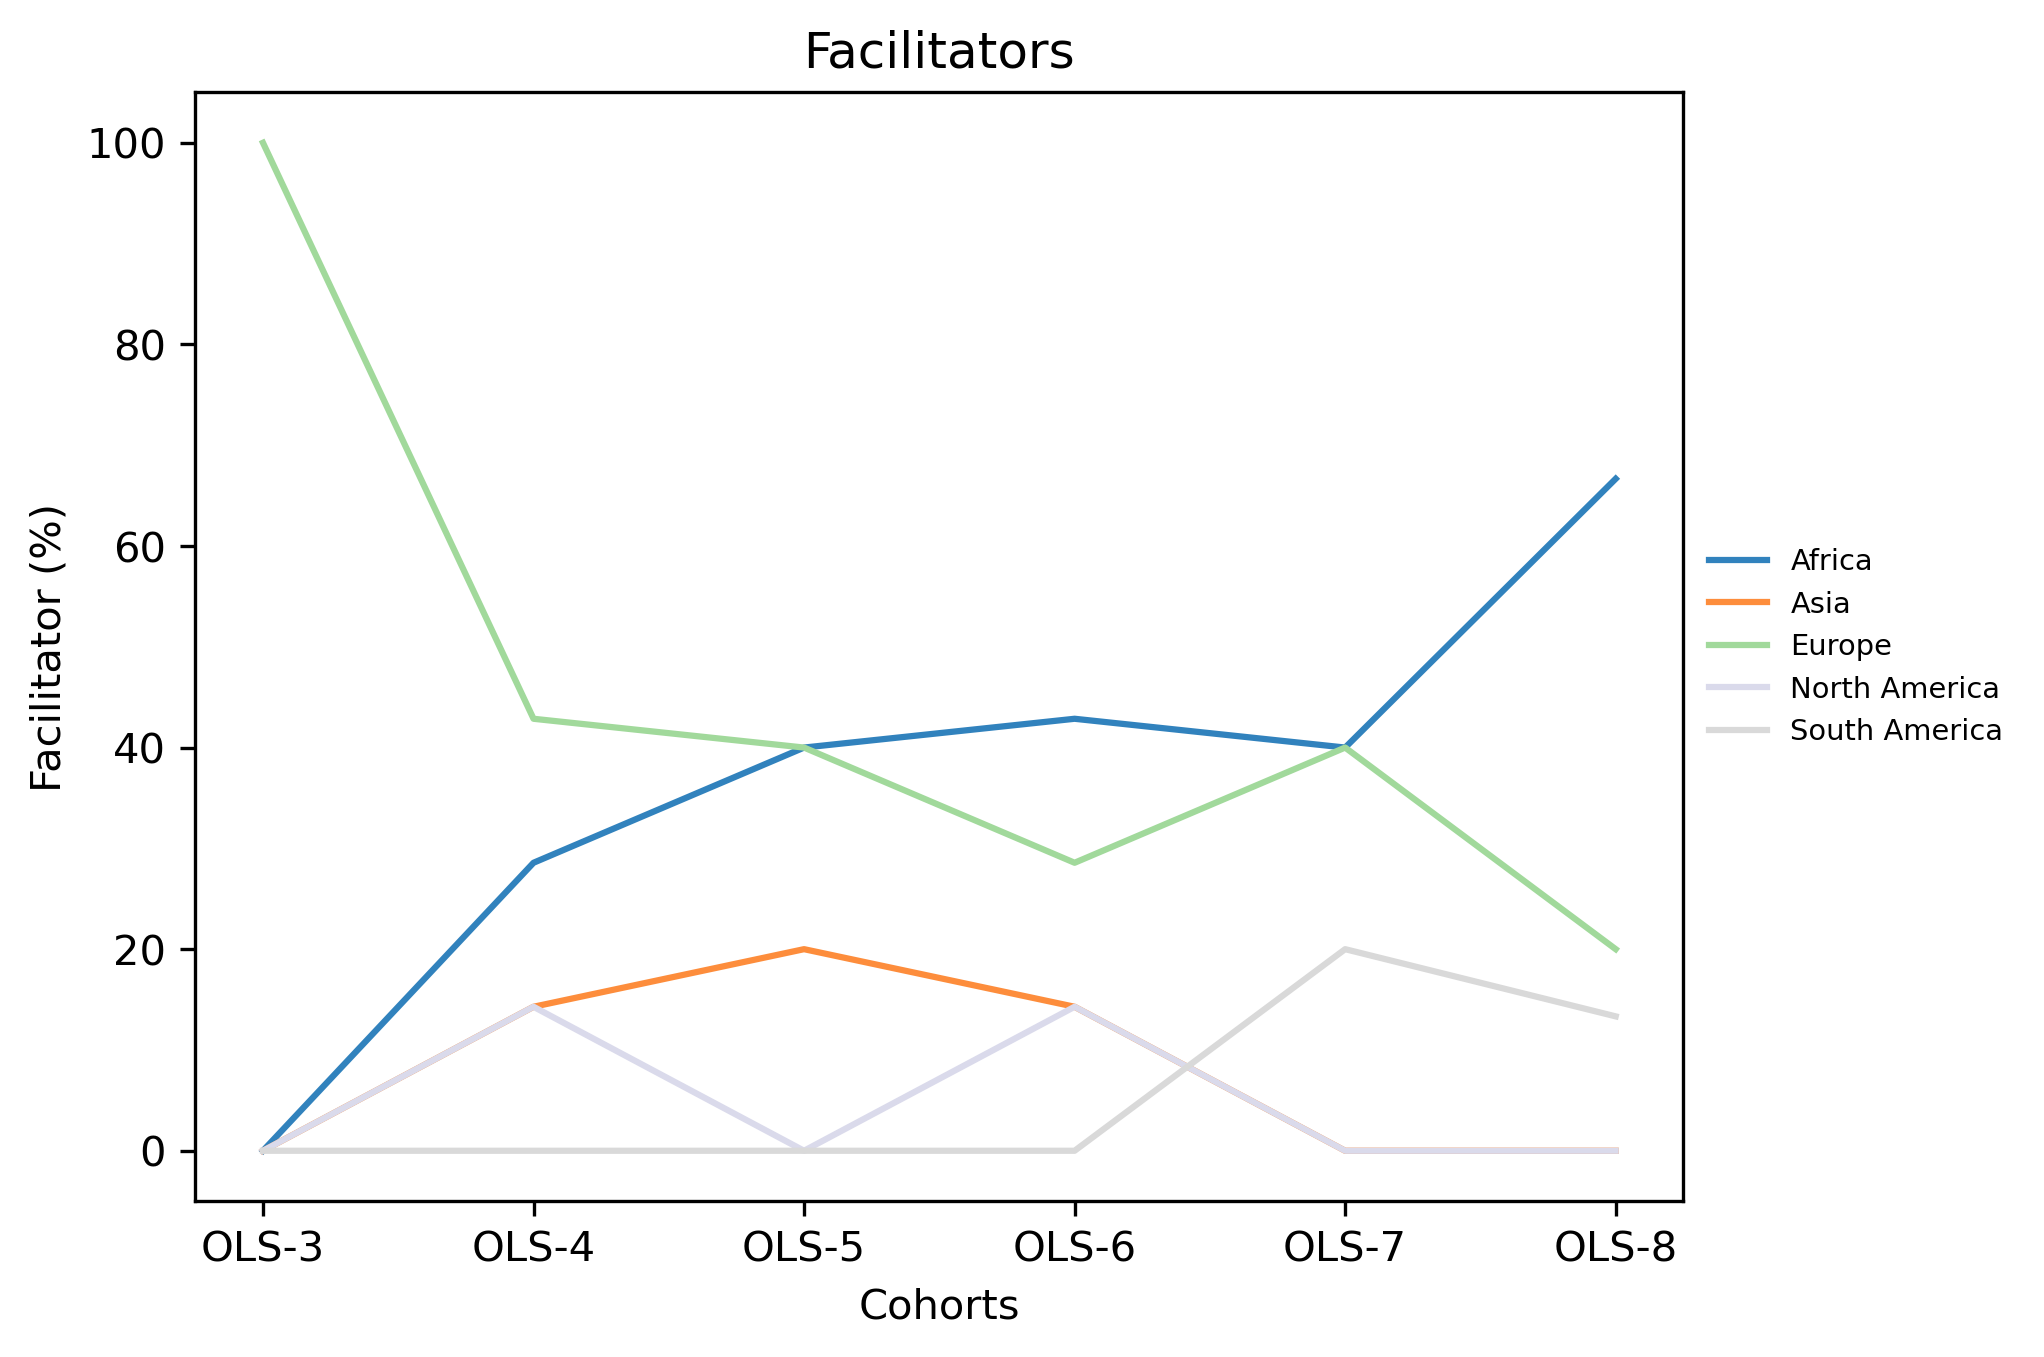
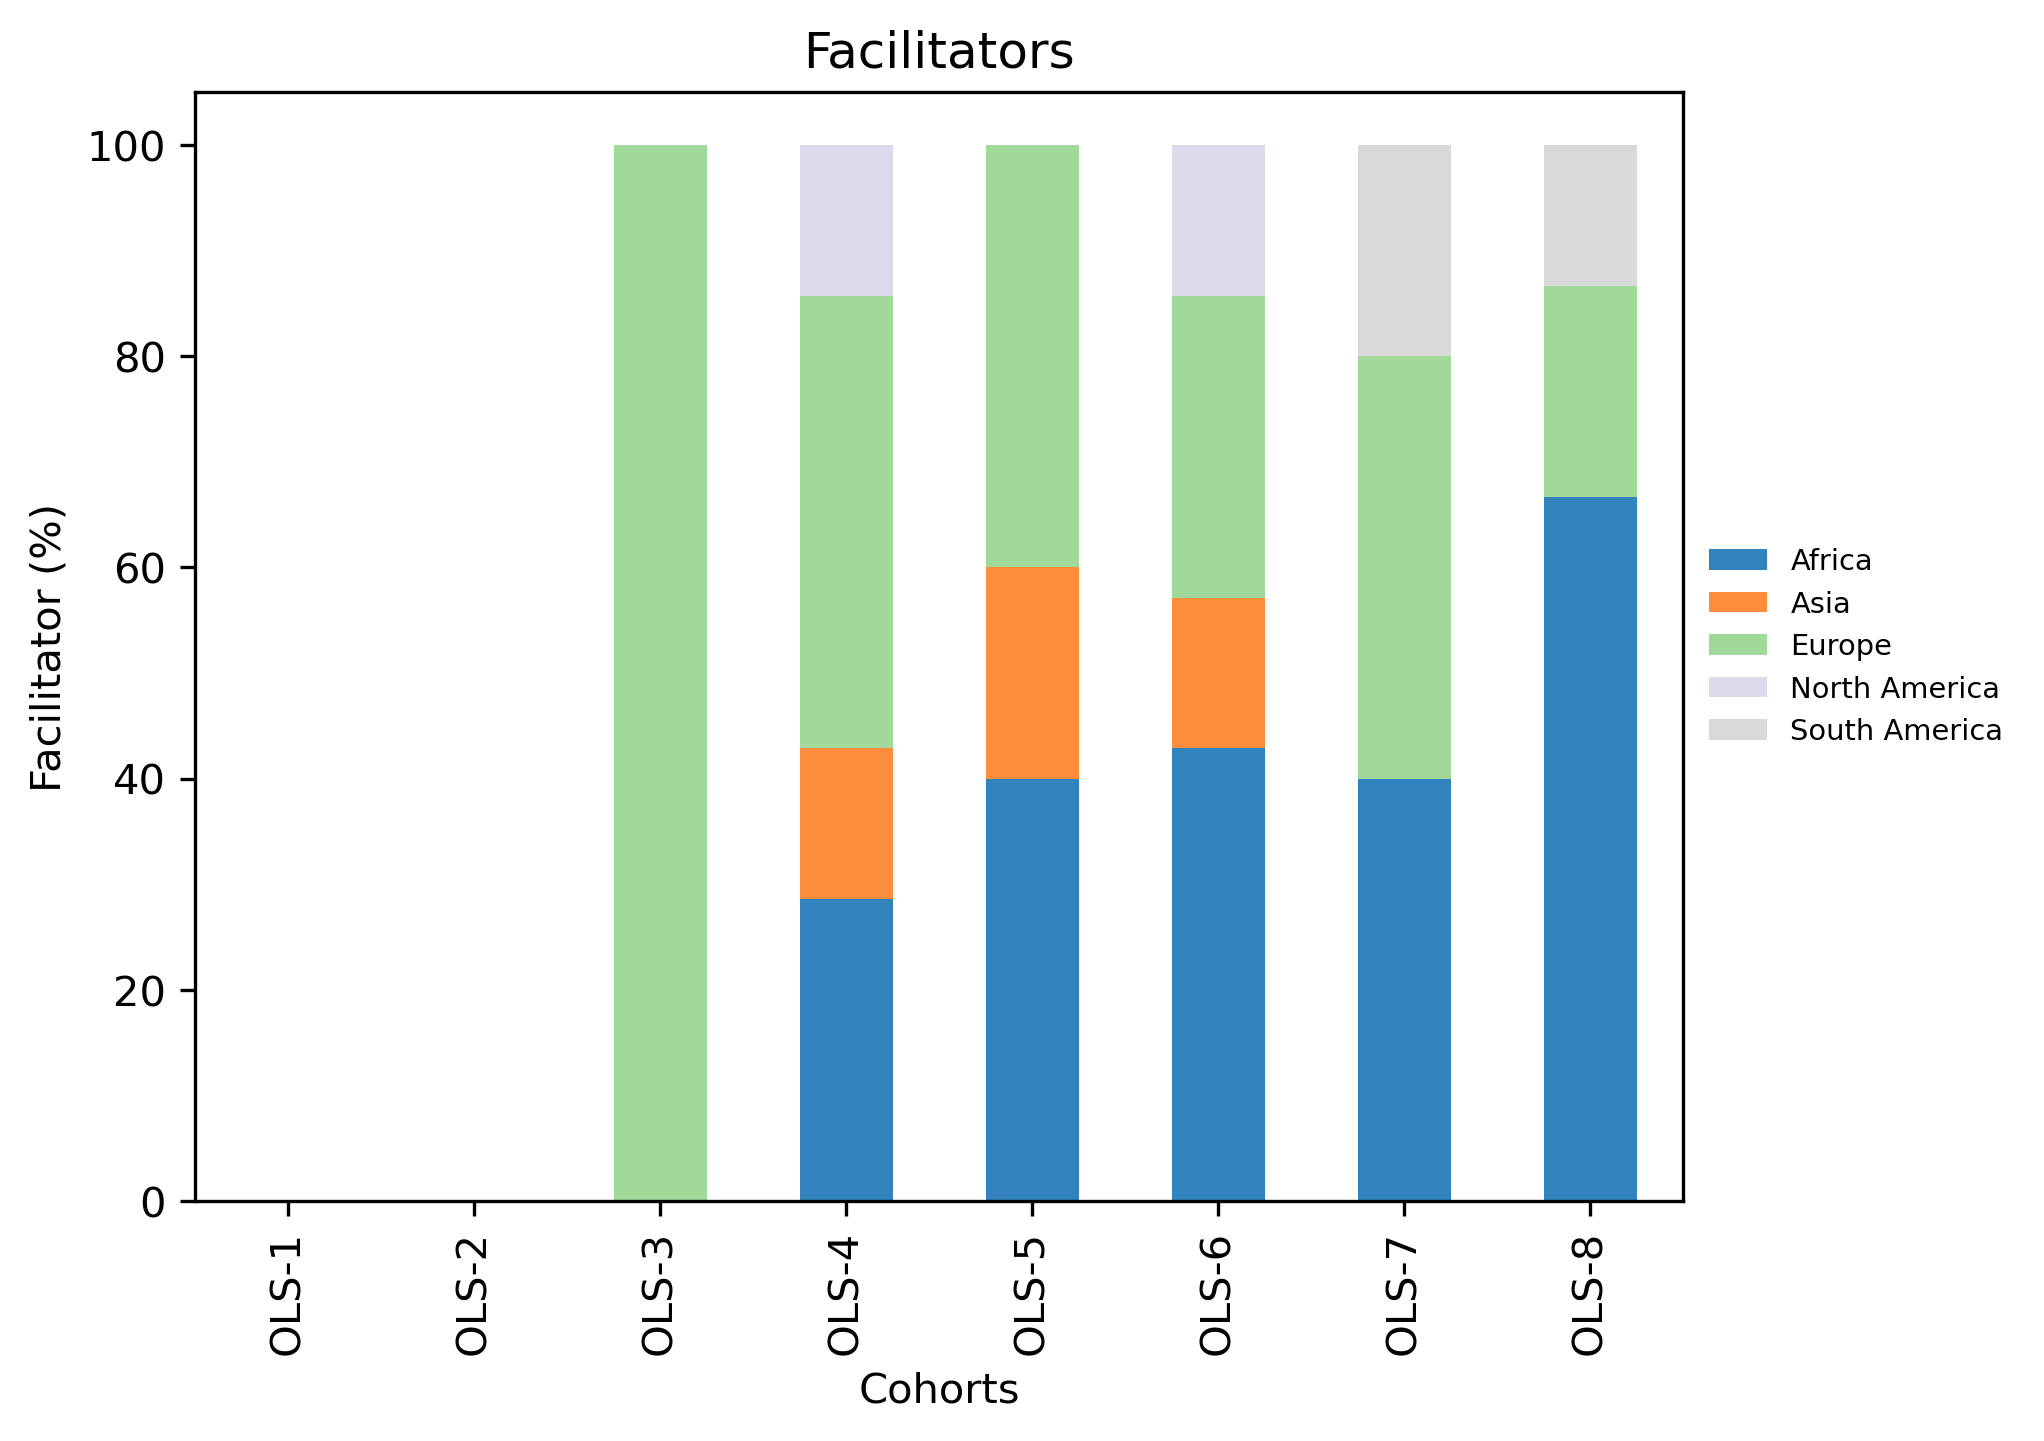
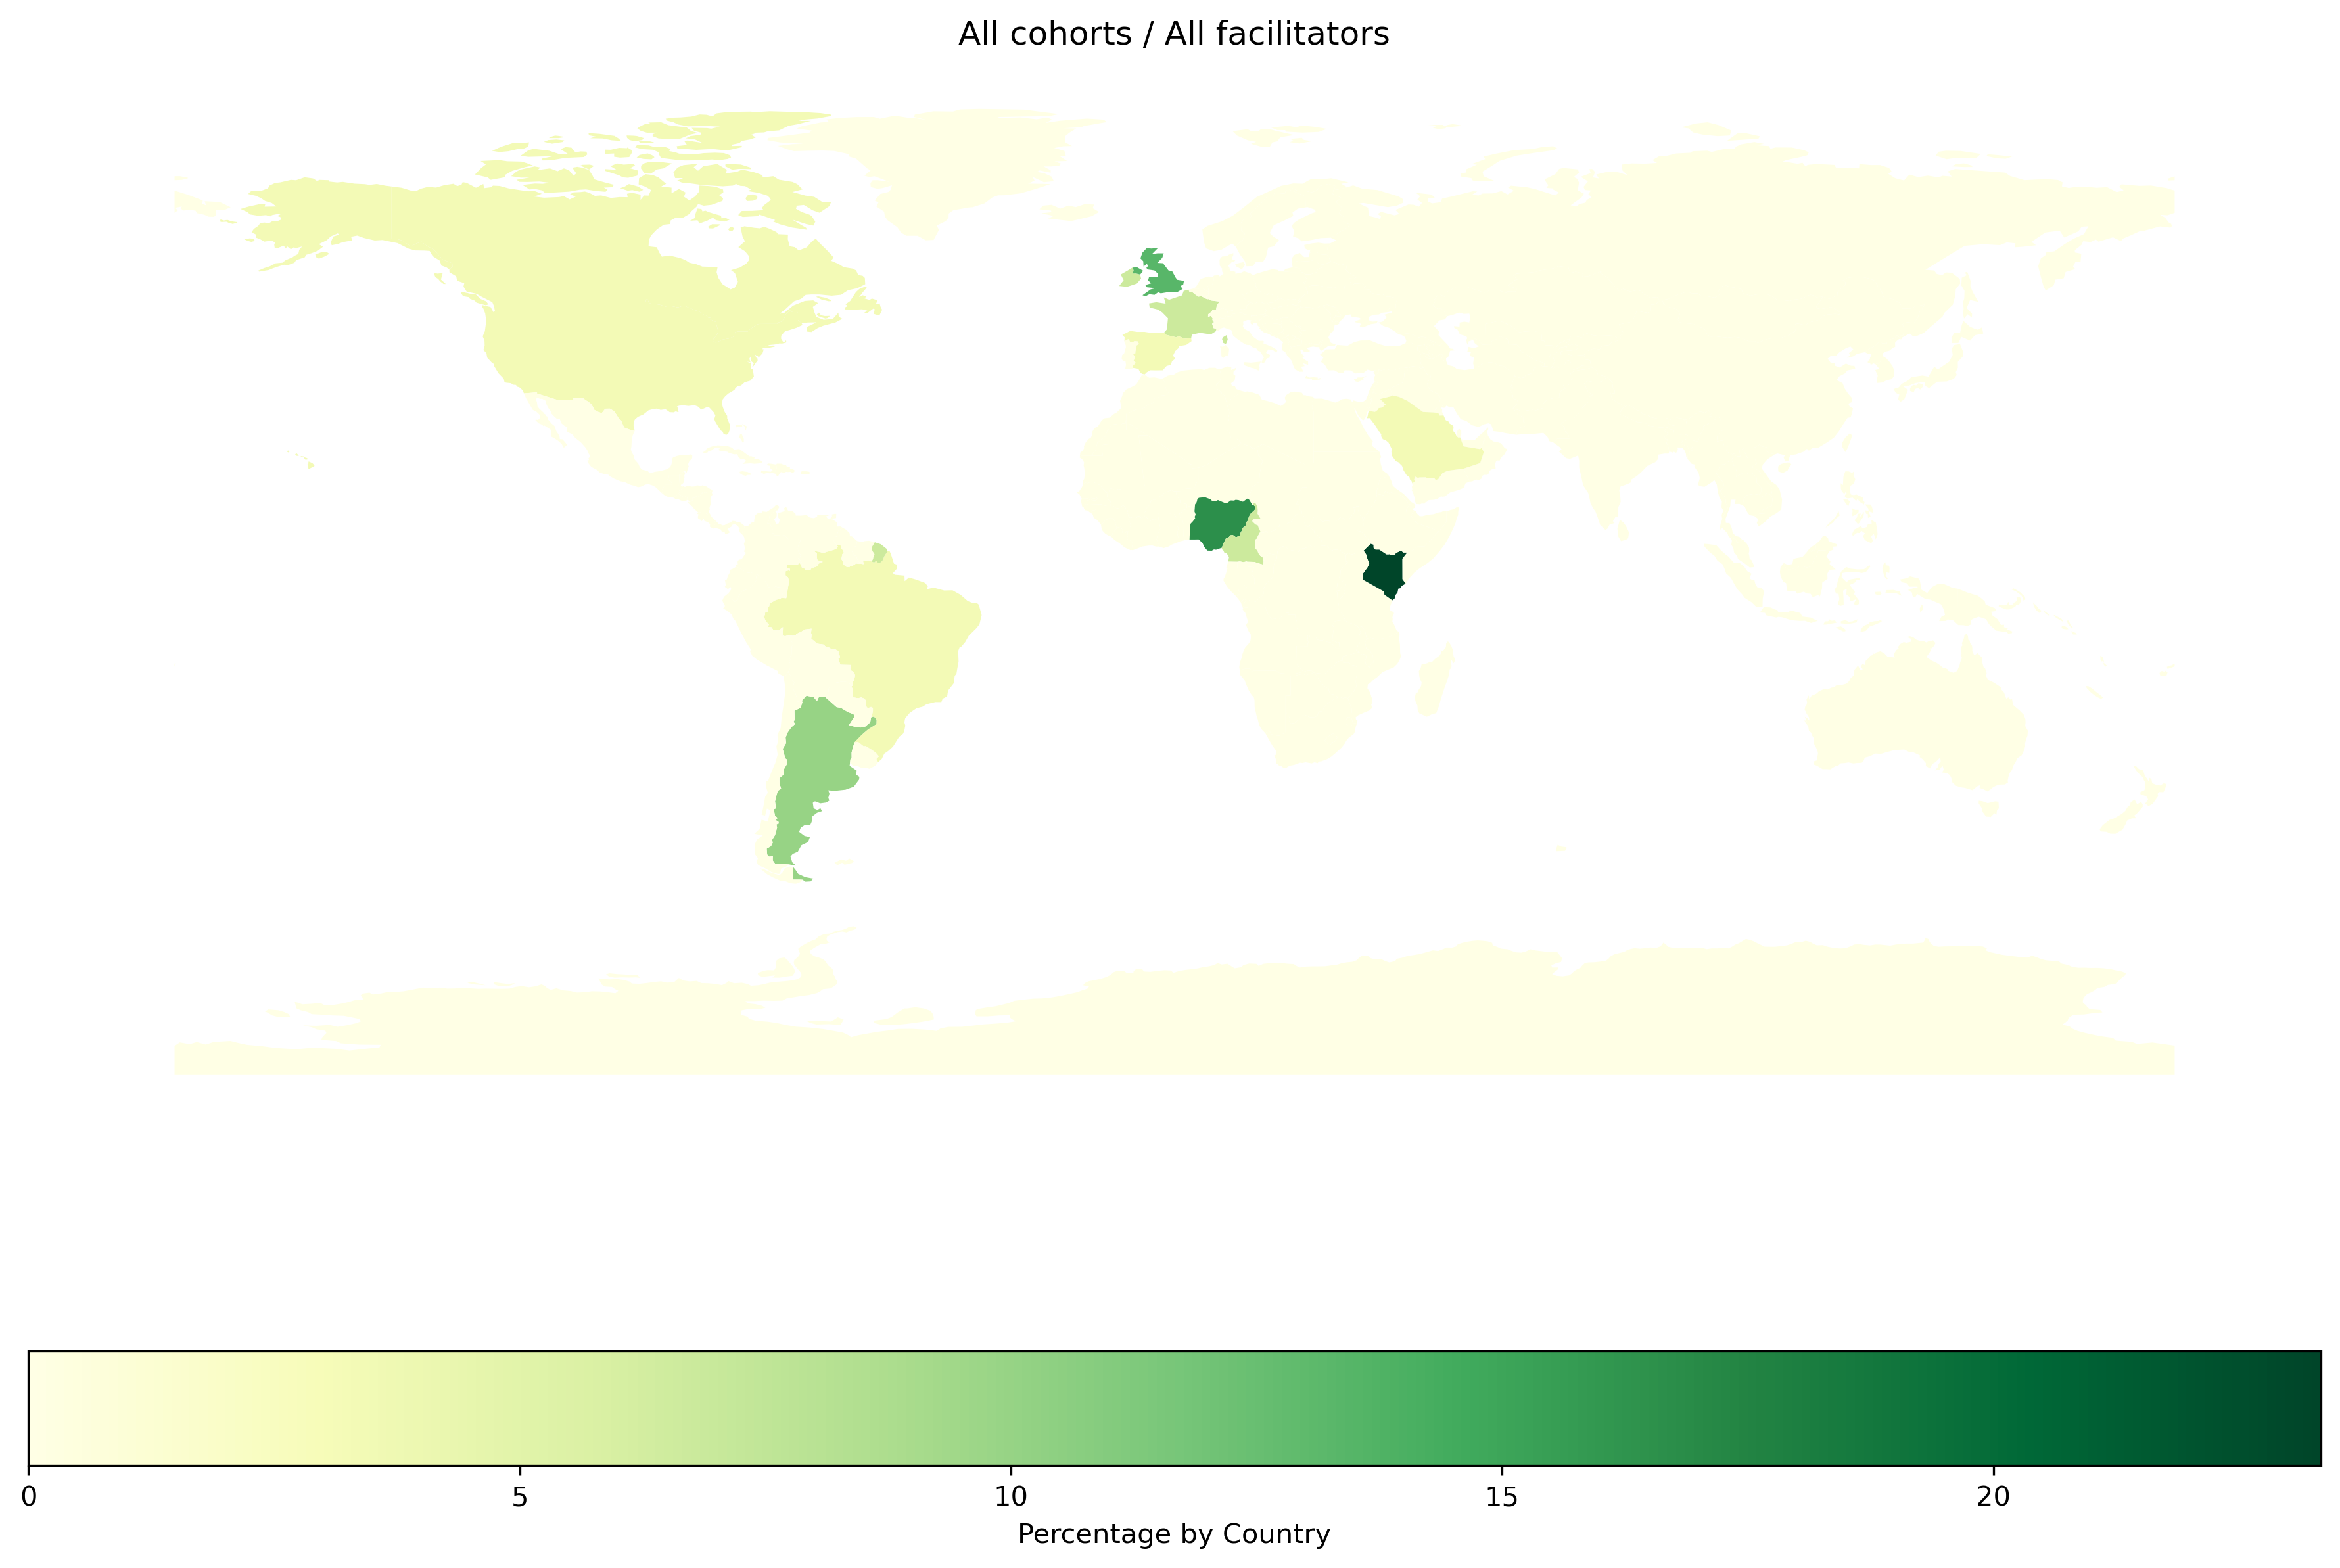
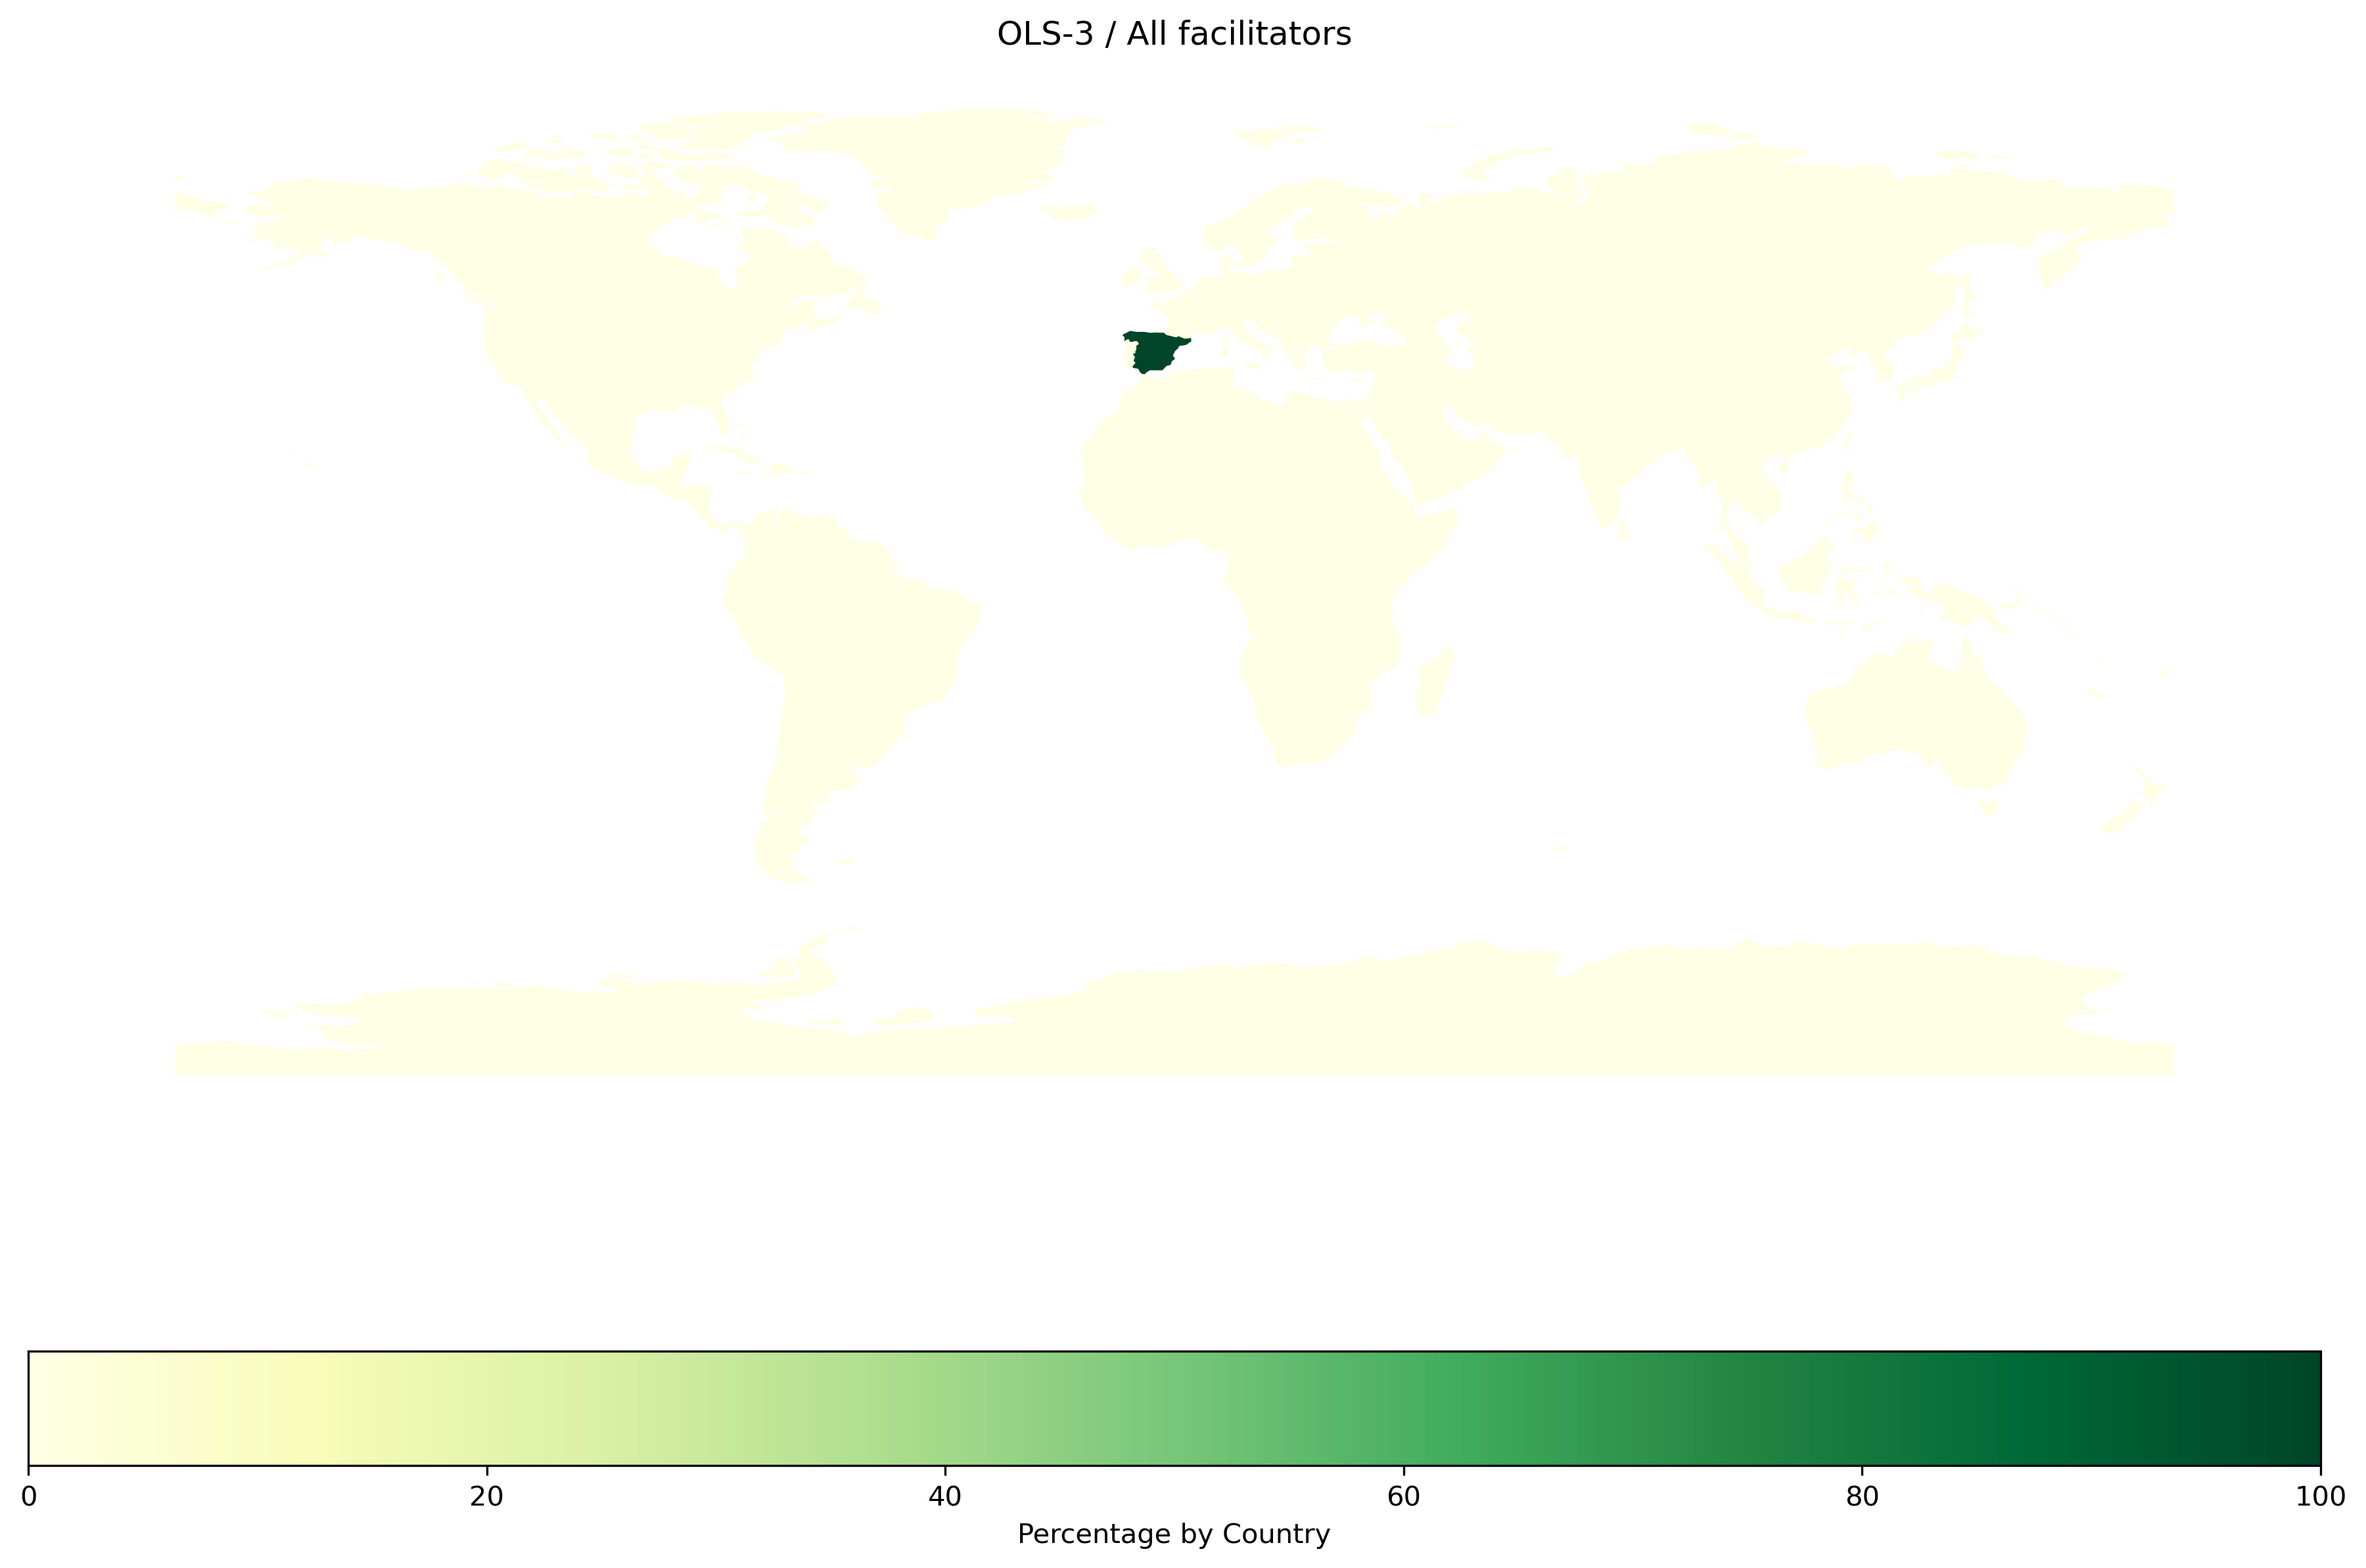
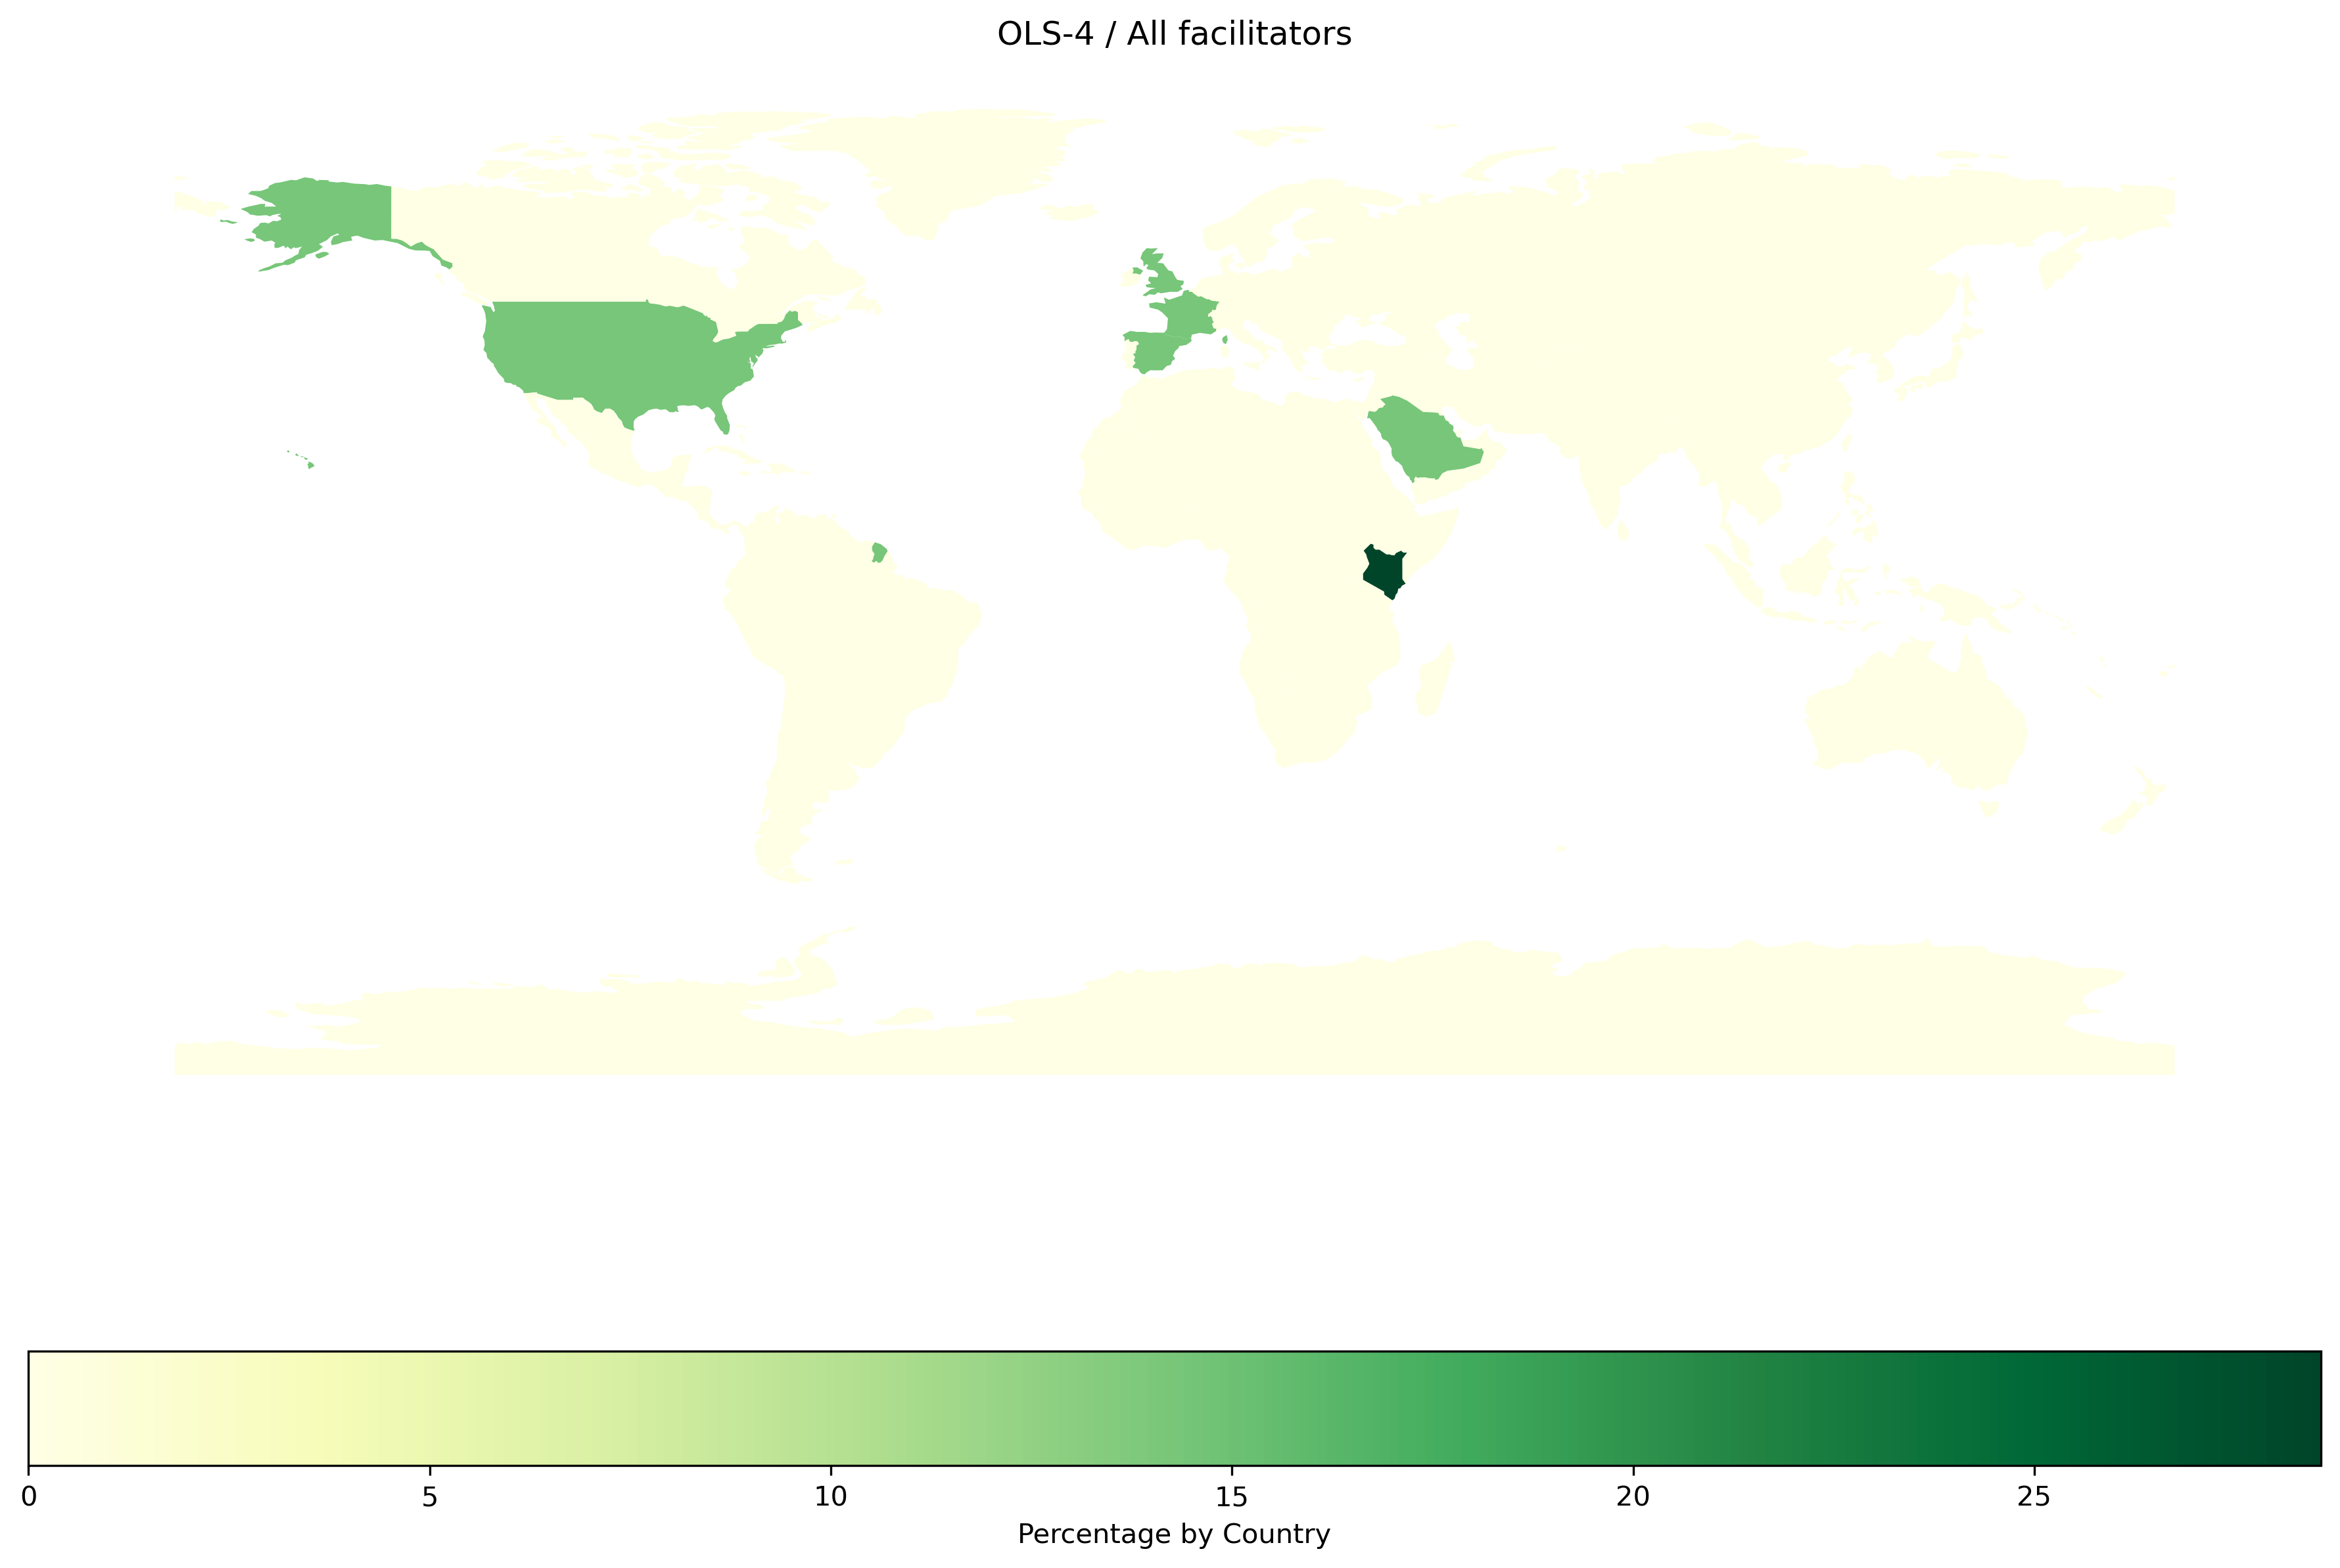
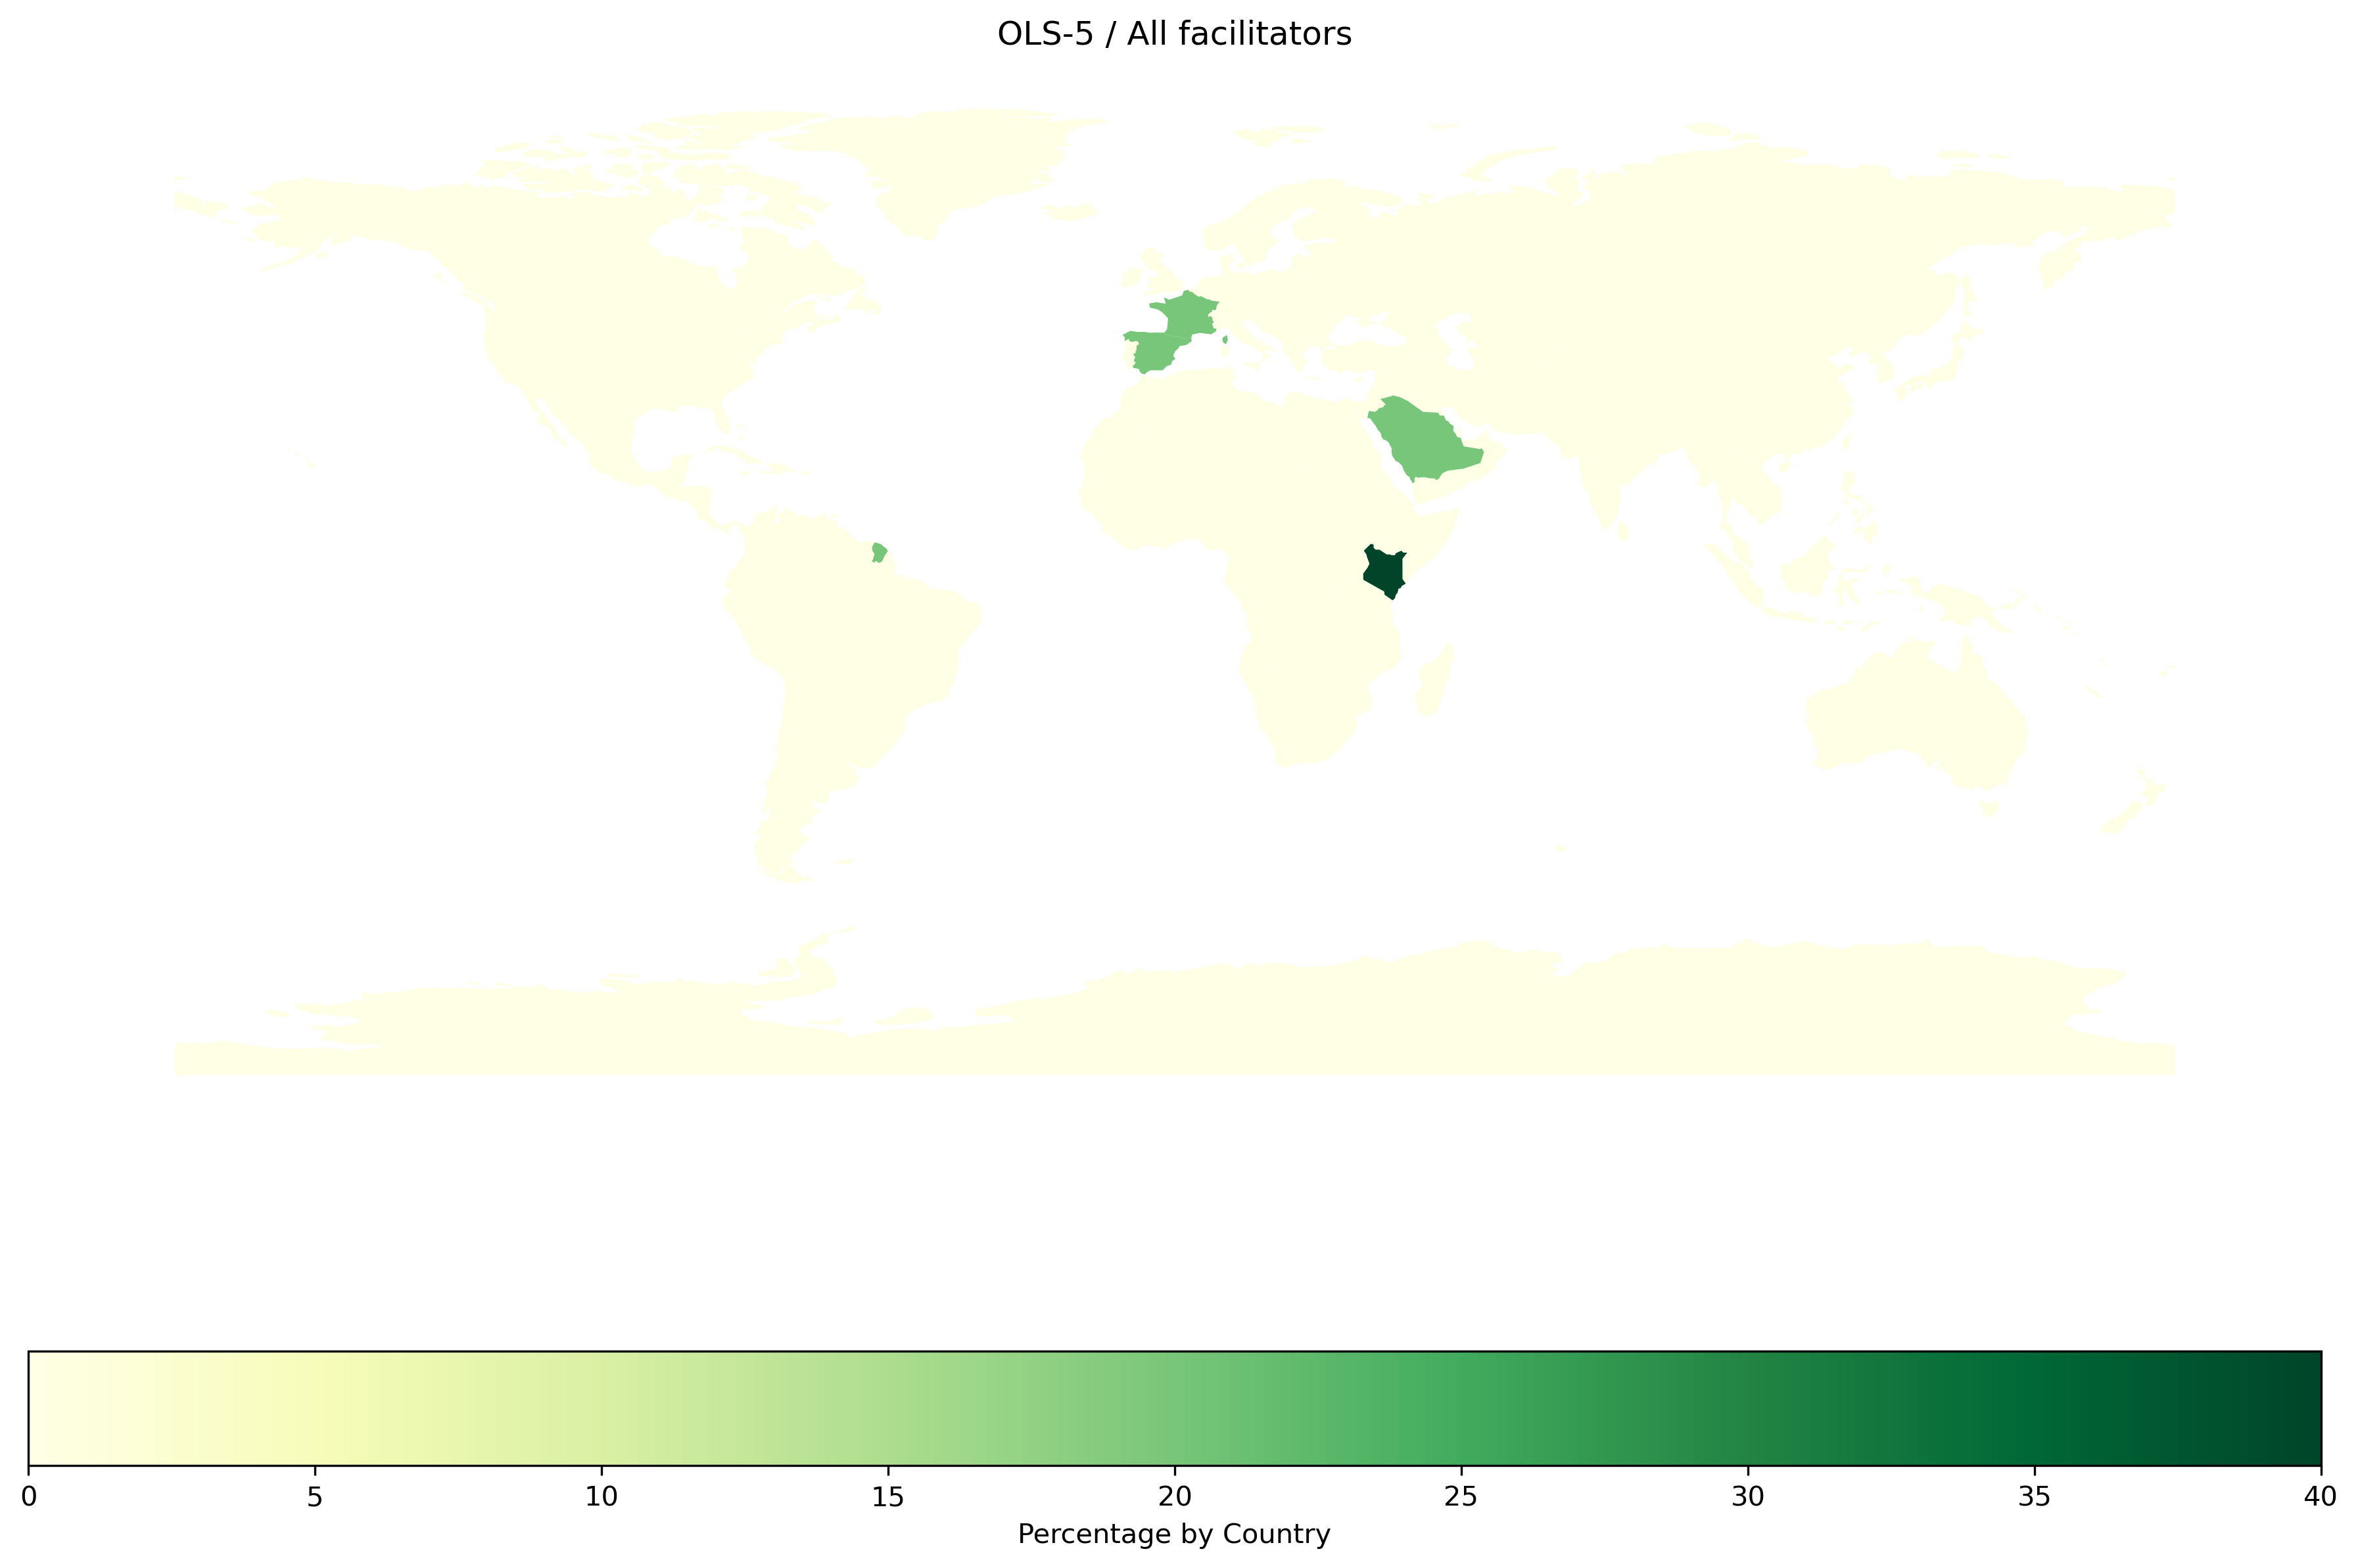
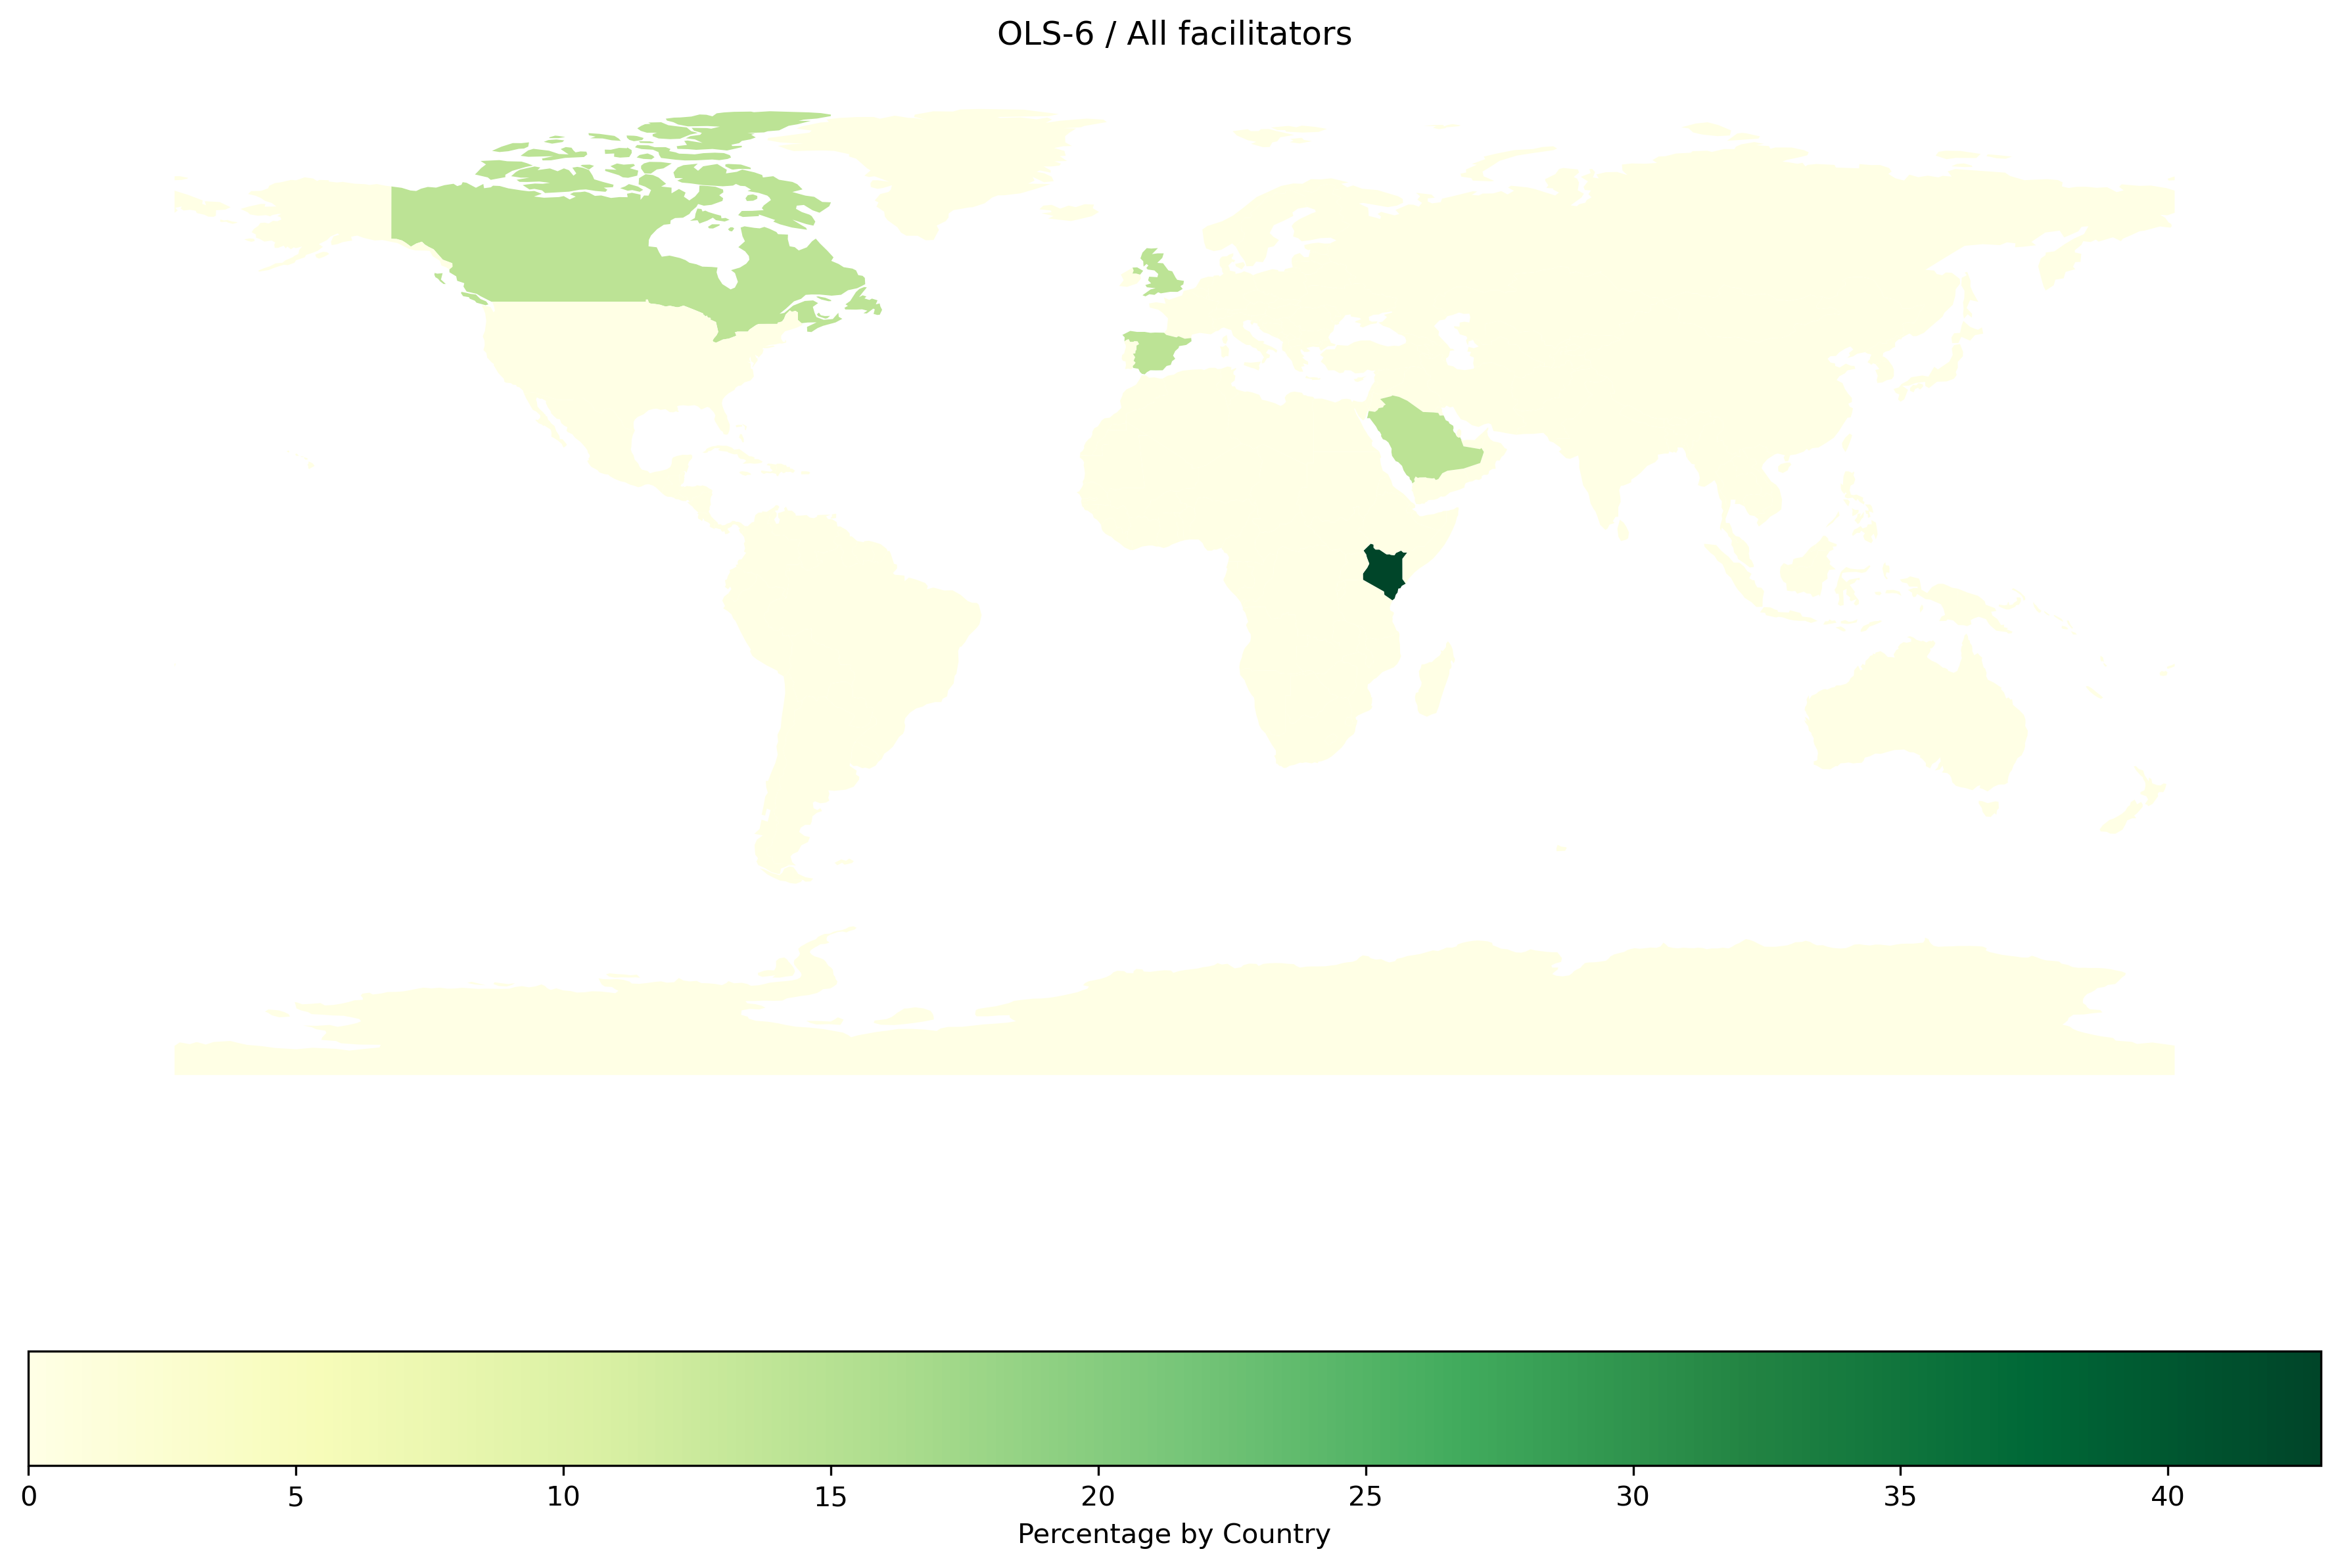
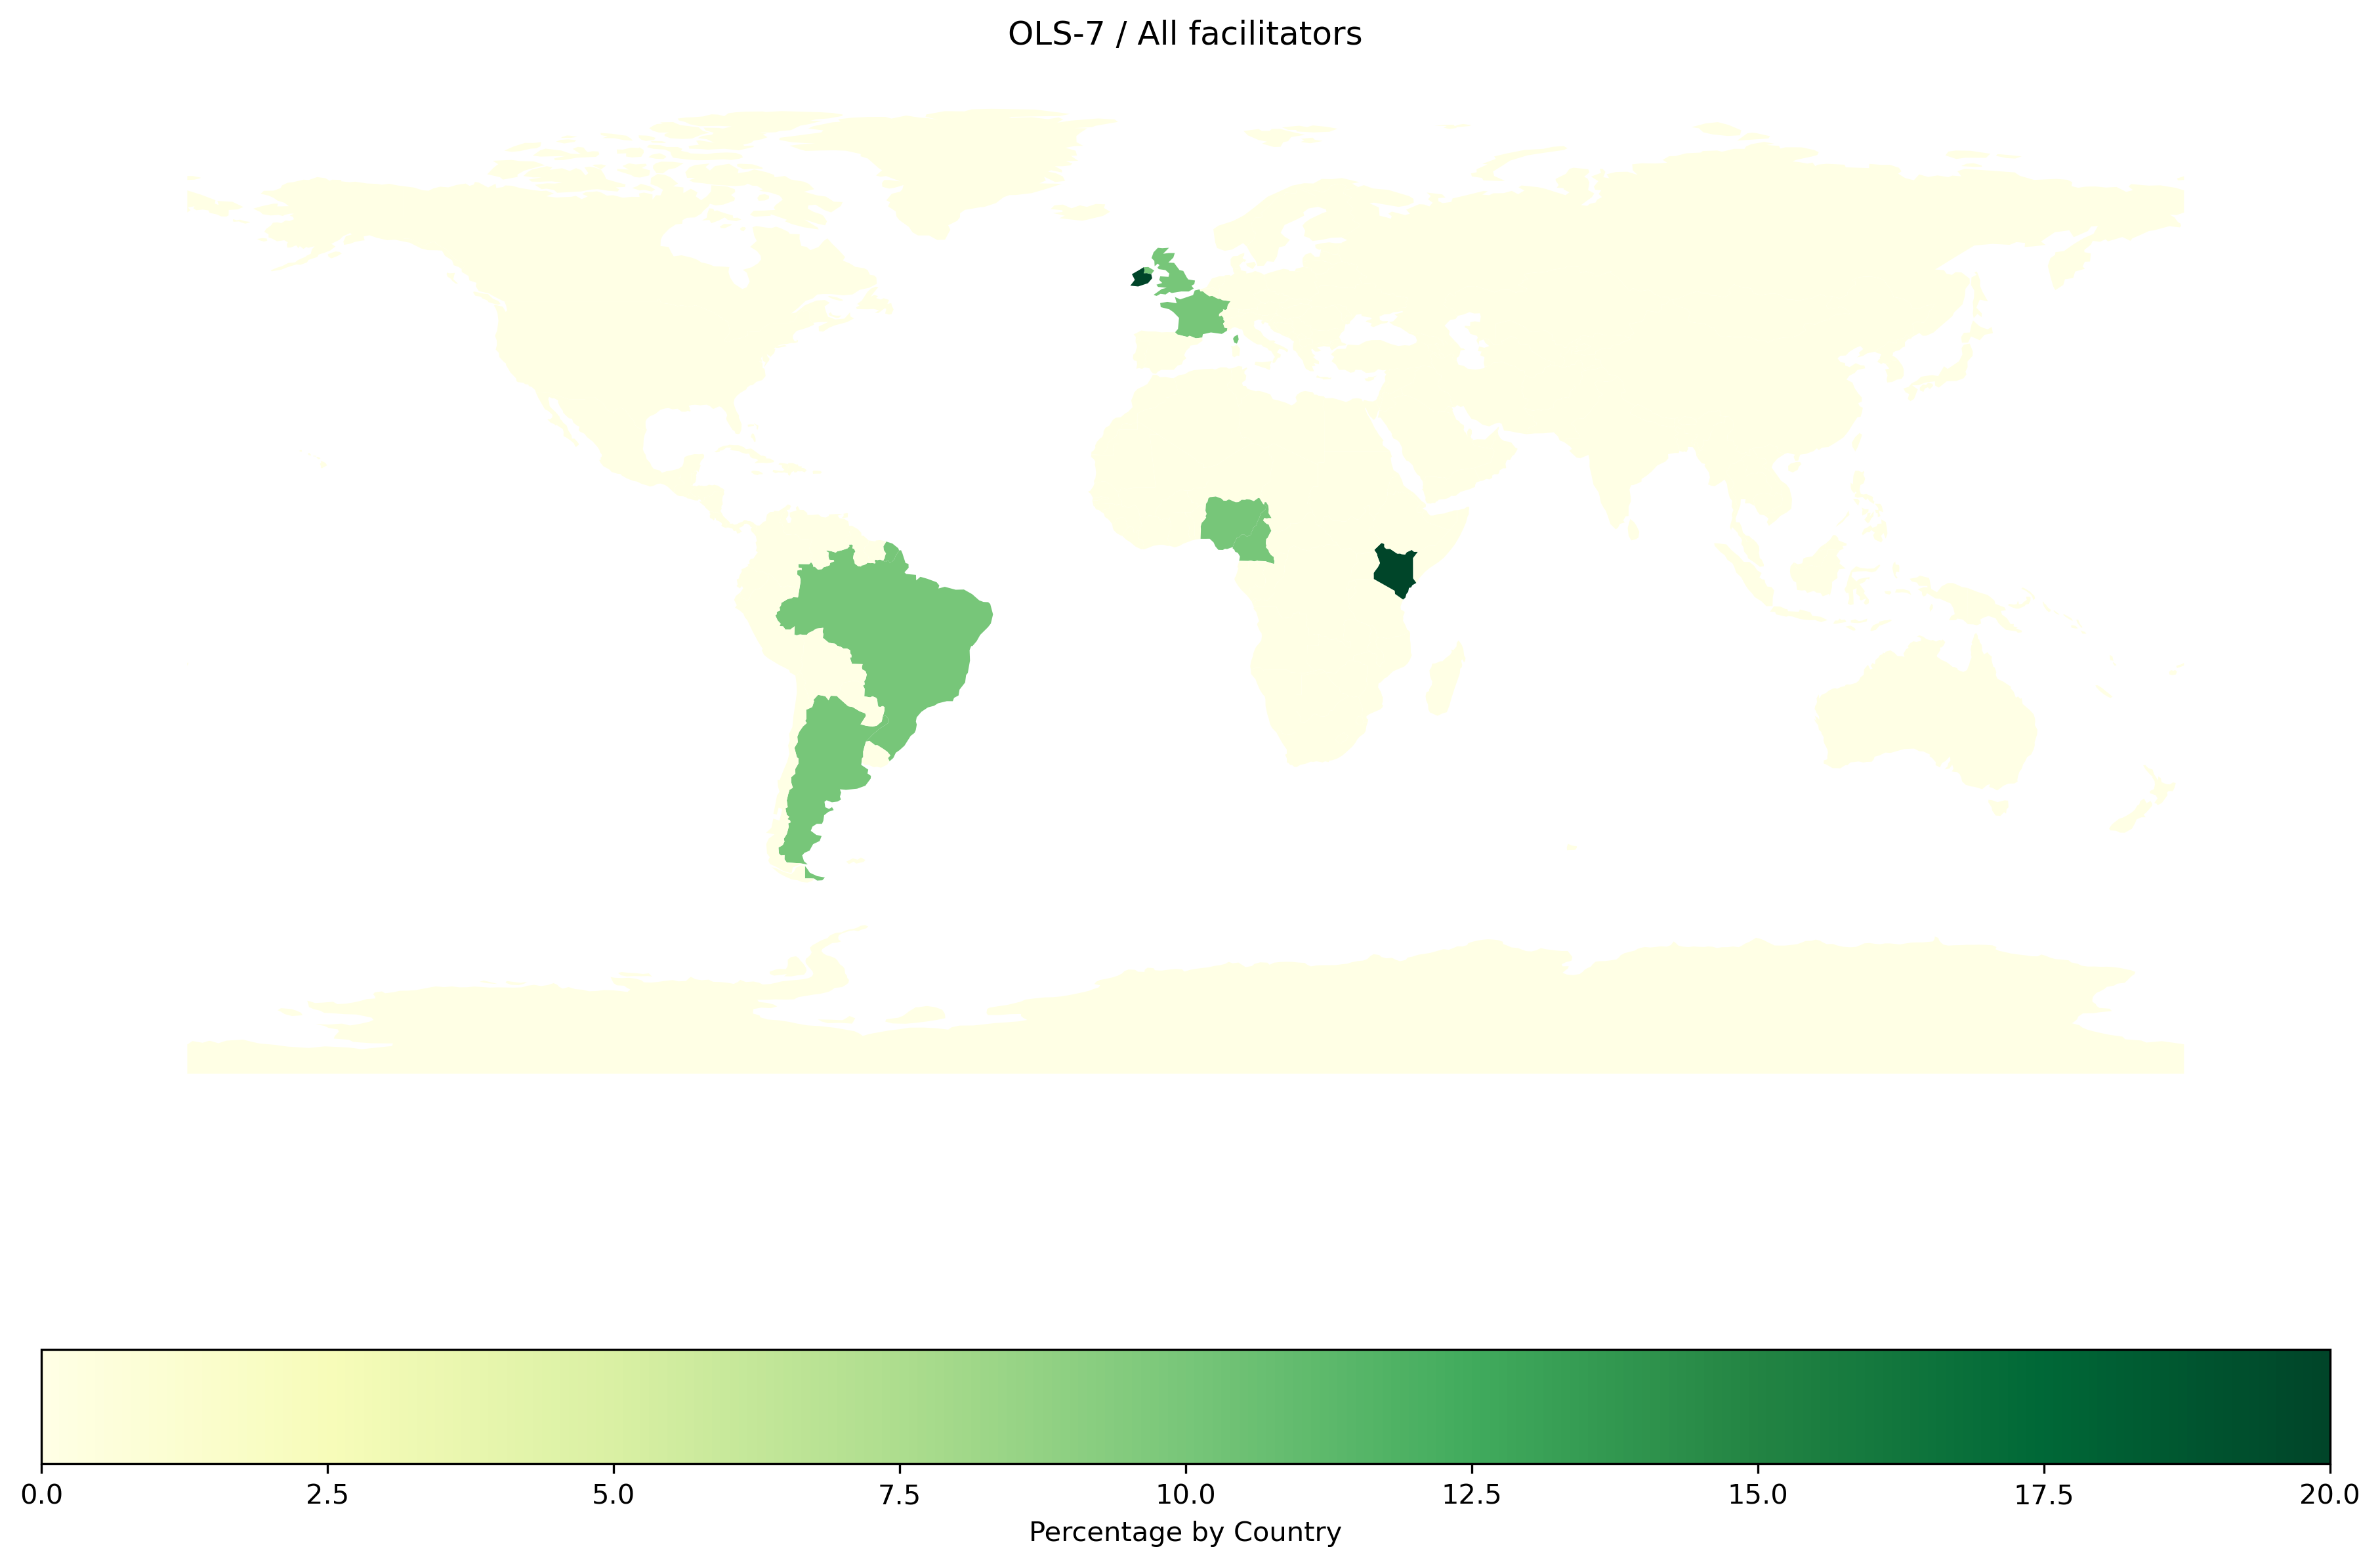
Facilitators
|
TOTAL |
OLS-1 |
OLS-2 |
OLS-3 |
OLS-4 |
OLS-5 |
OLS-6 |
OLS-7 |
OLS-8 |
| continent |
|
|
|
|
|
|
|
|
|
| Africa |
46.666667 |
NaN |
NaN |
0.0 |
28.571429 |
40.0 |
42.857143 |
40.0 |
66.666667 |
| Asia |
3.333333 |
NaN |
NaN |
0.0 |
14.285714 |
20.0 |
14.285714 |
0.0 |
0.000000 |
| Europe |
30.000000 |
NaN |
NaN |
100.0 |
42.857143 |
40.0 |
28.571429 |
40.0 |
20.000000 |
| North America |
6.666667 |
NaN |
NaN |
0.0 |
14.285714 |
0.0 |
14.285714 |
0.0 |
0.000000 |
| South America |
13.333333 |
NaN |
NaN |
0.0 |
0.000000 |
0.0 |
0.000000 |
20.0 |
13.333333 |
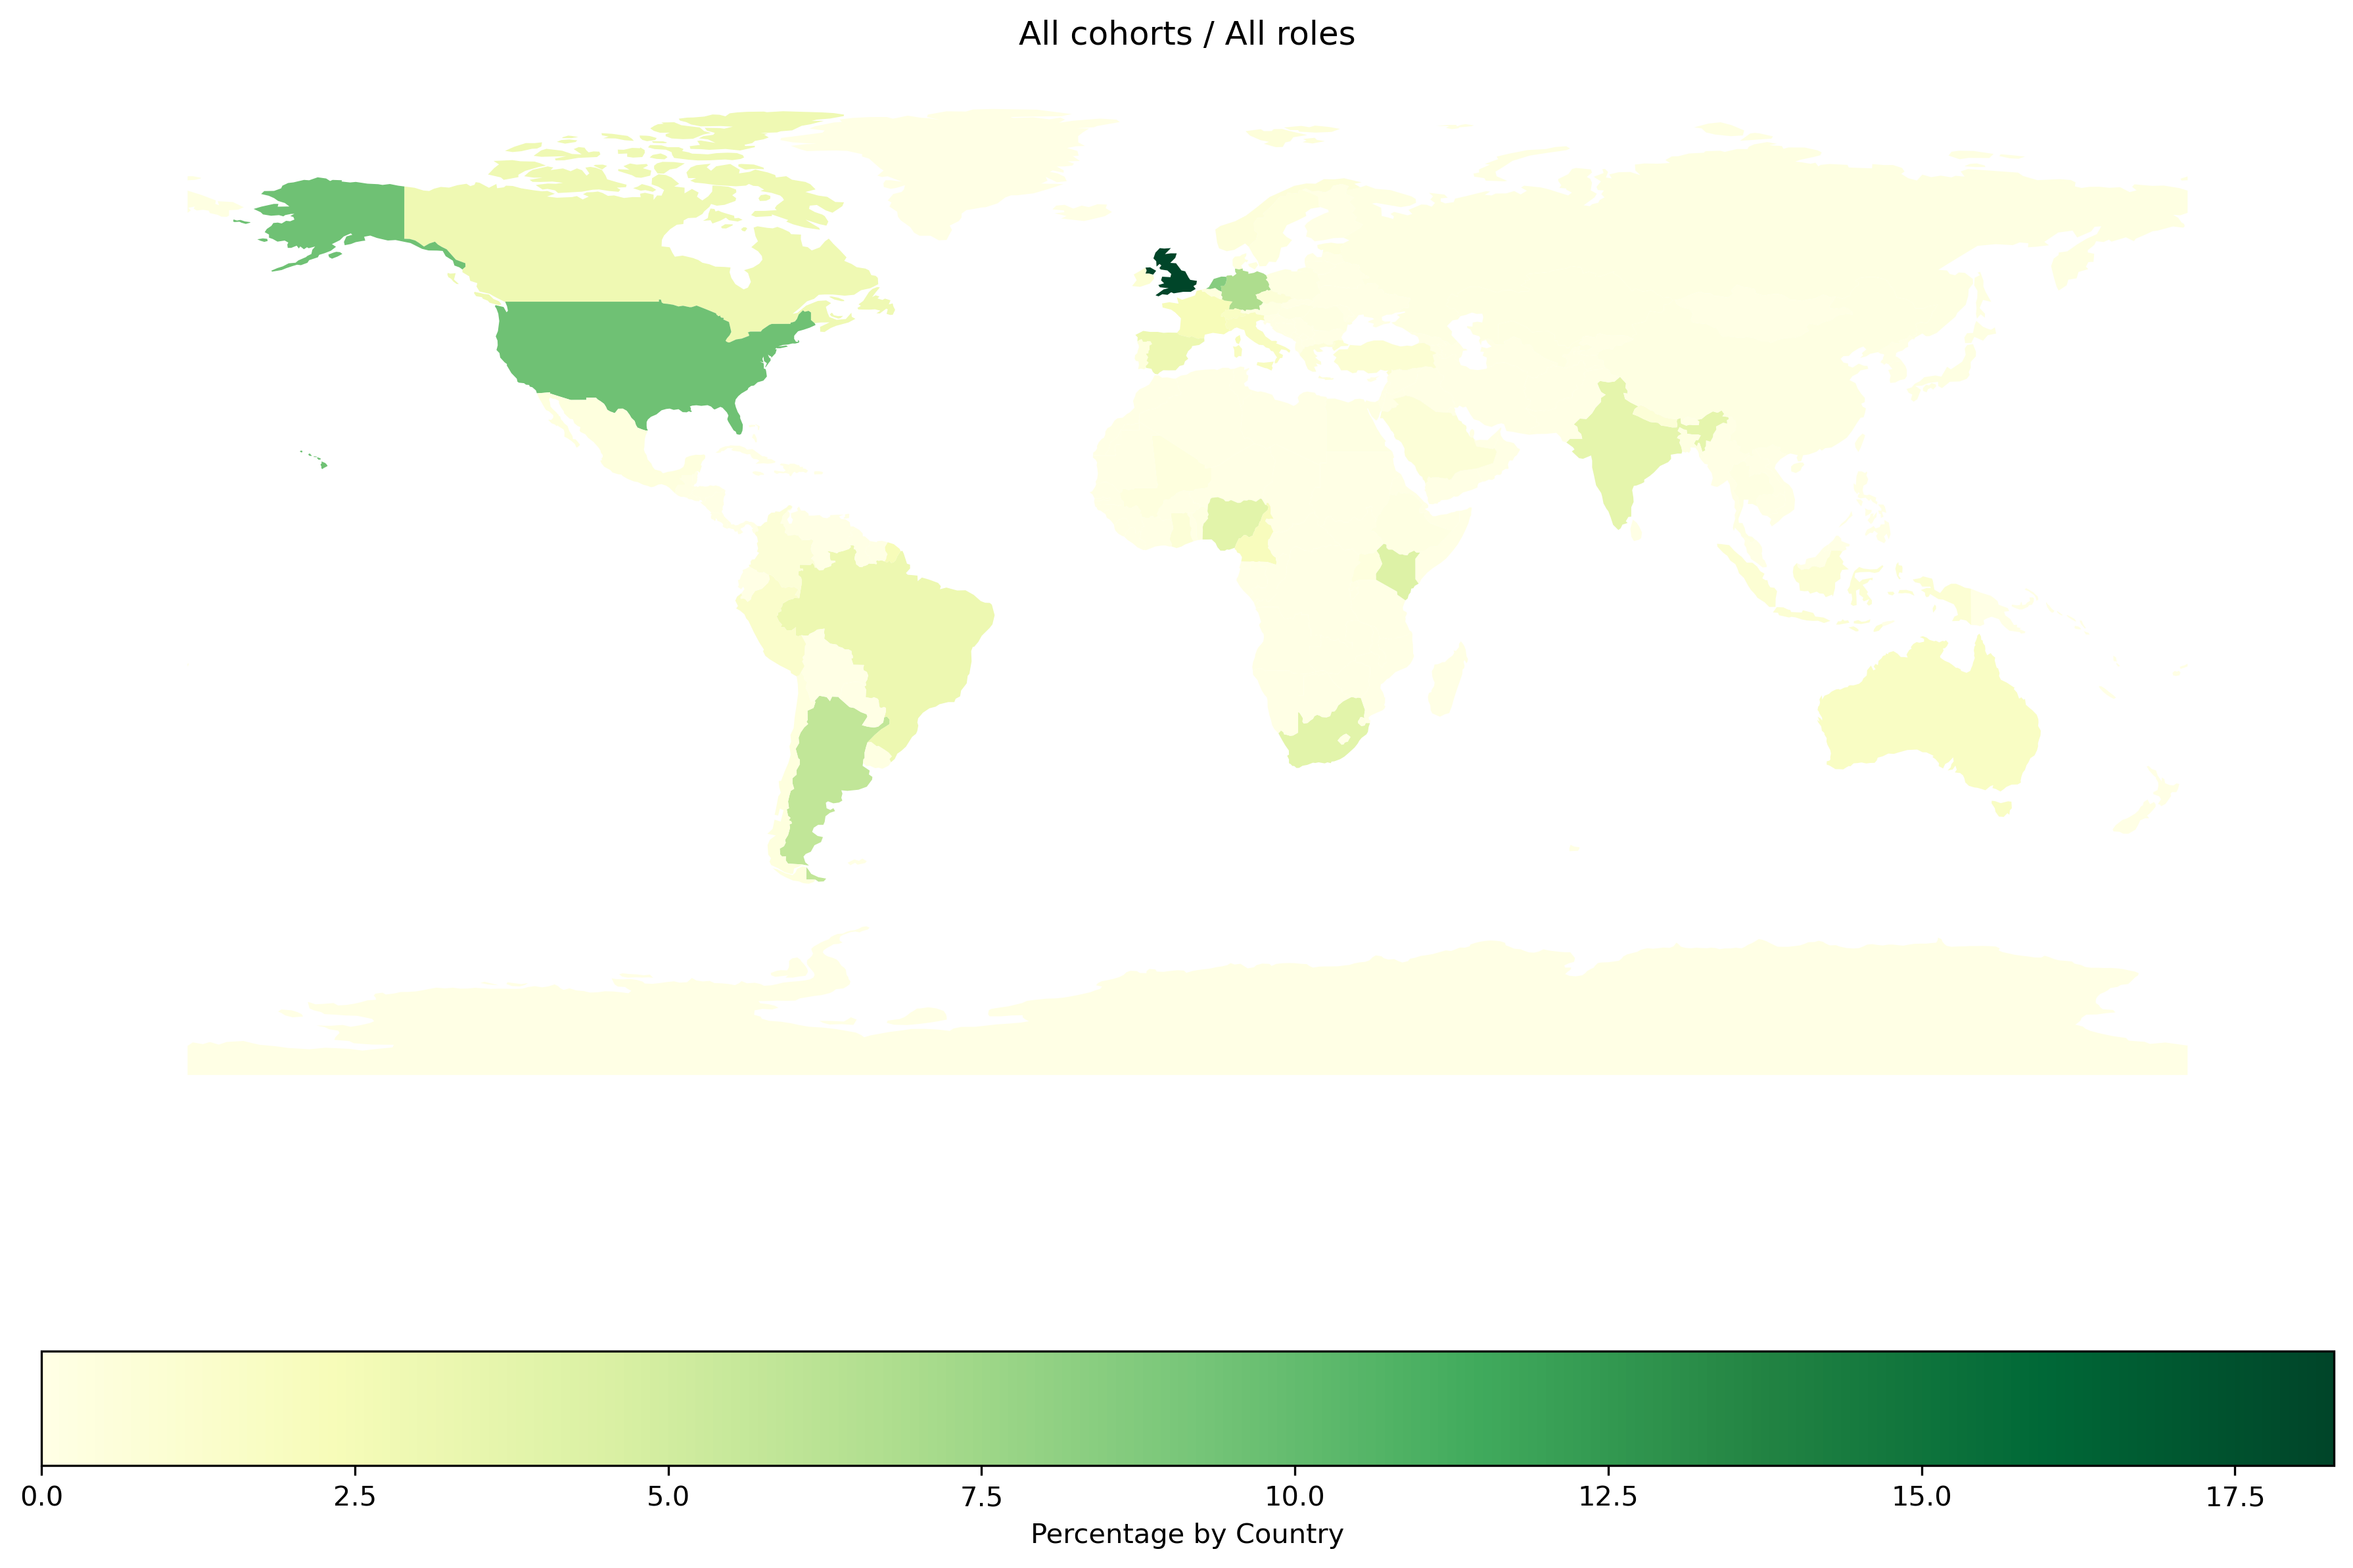
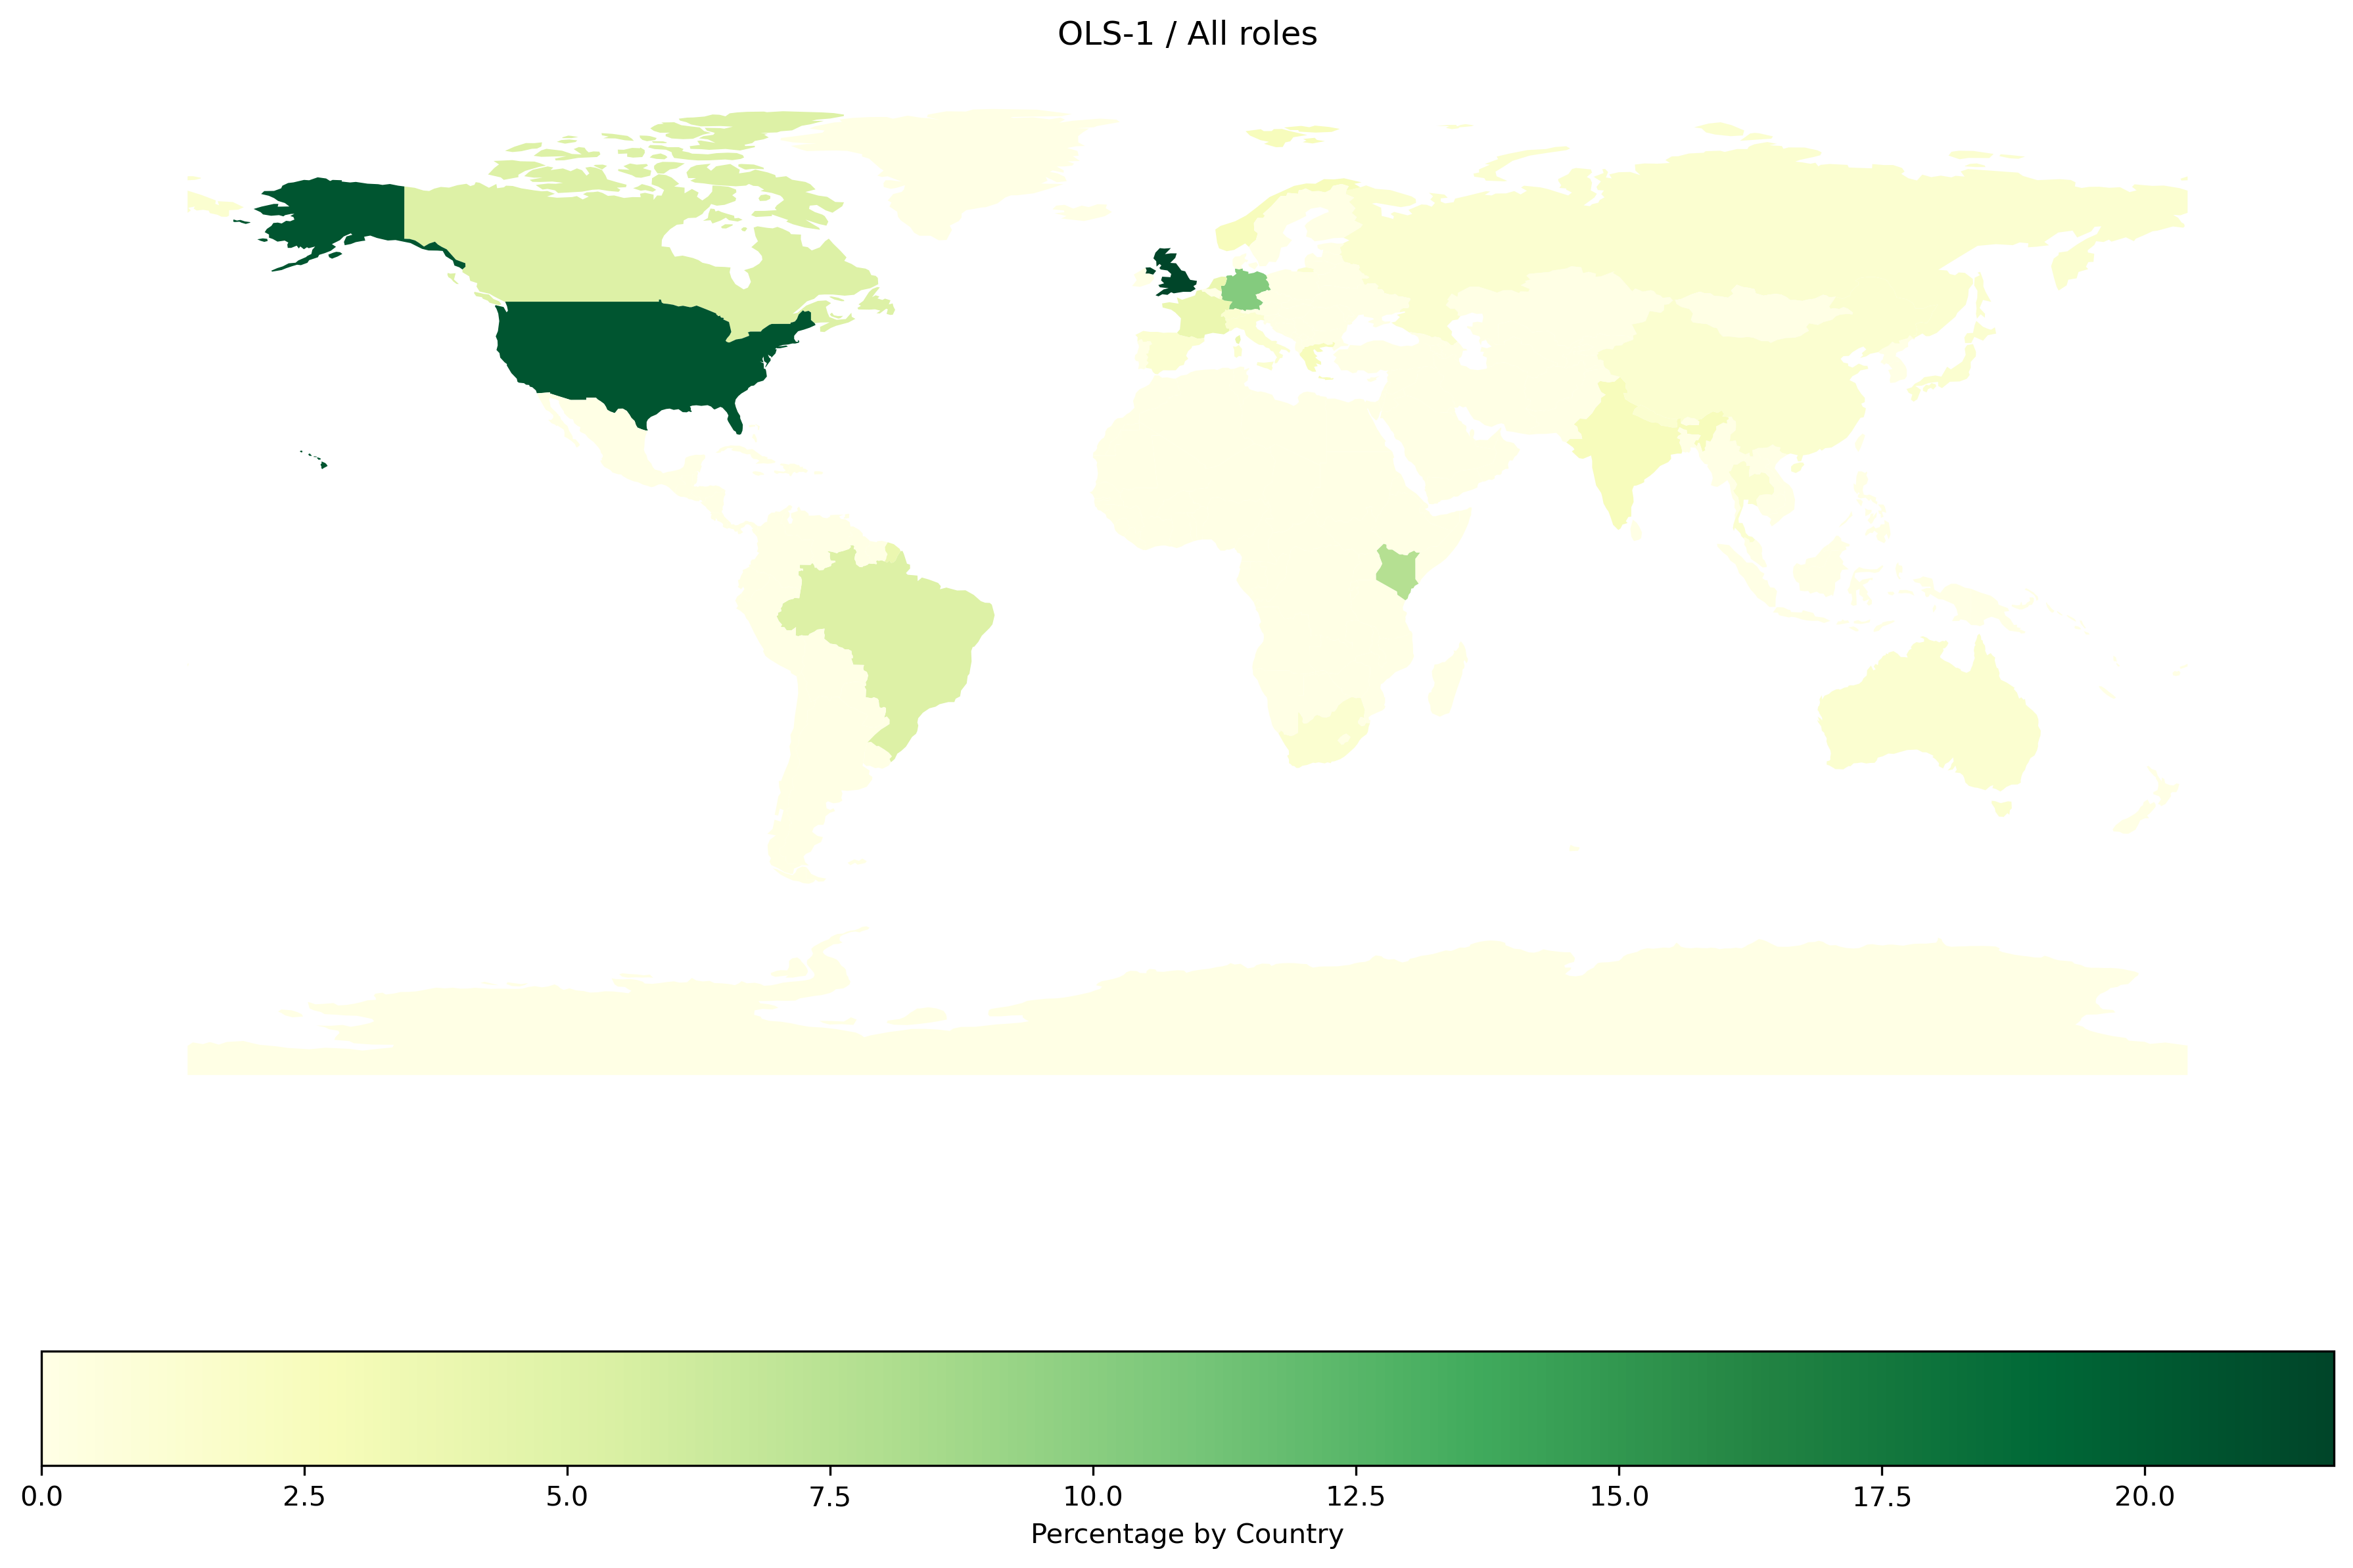
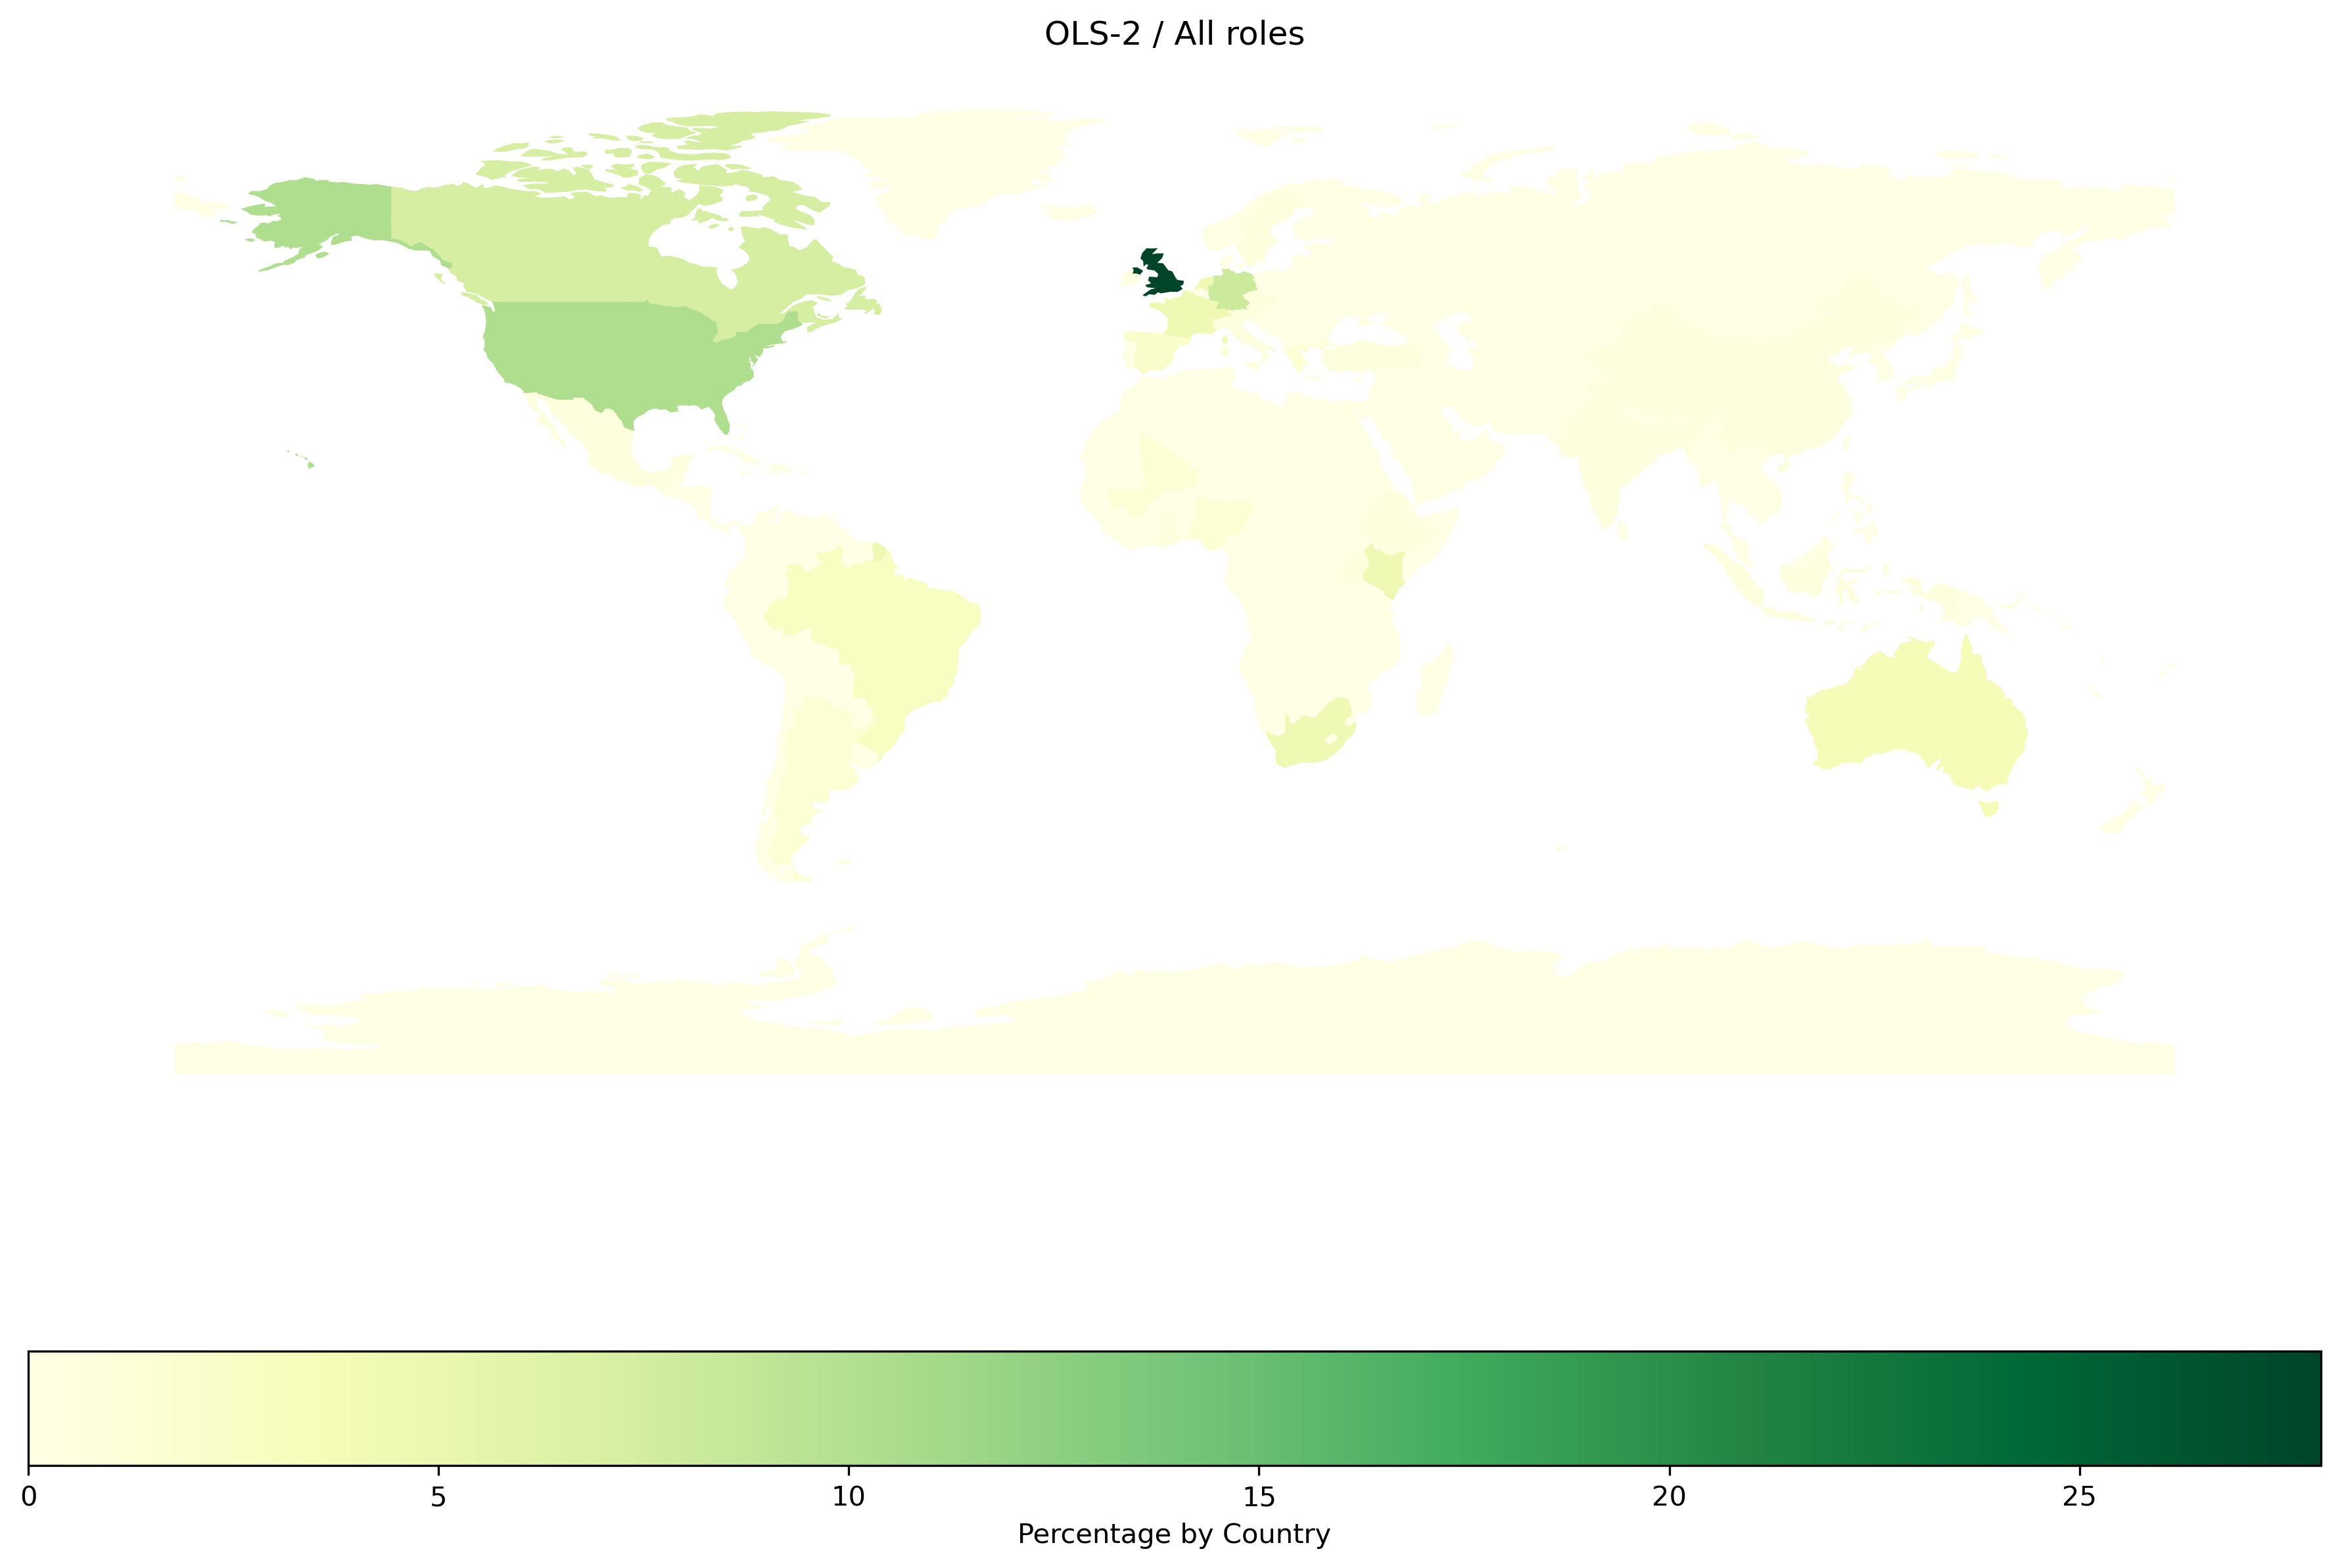
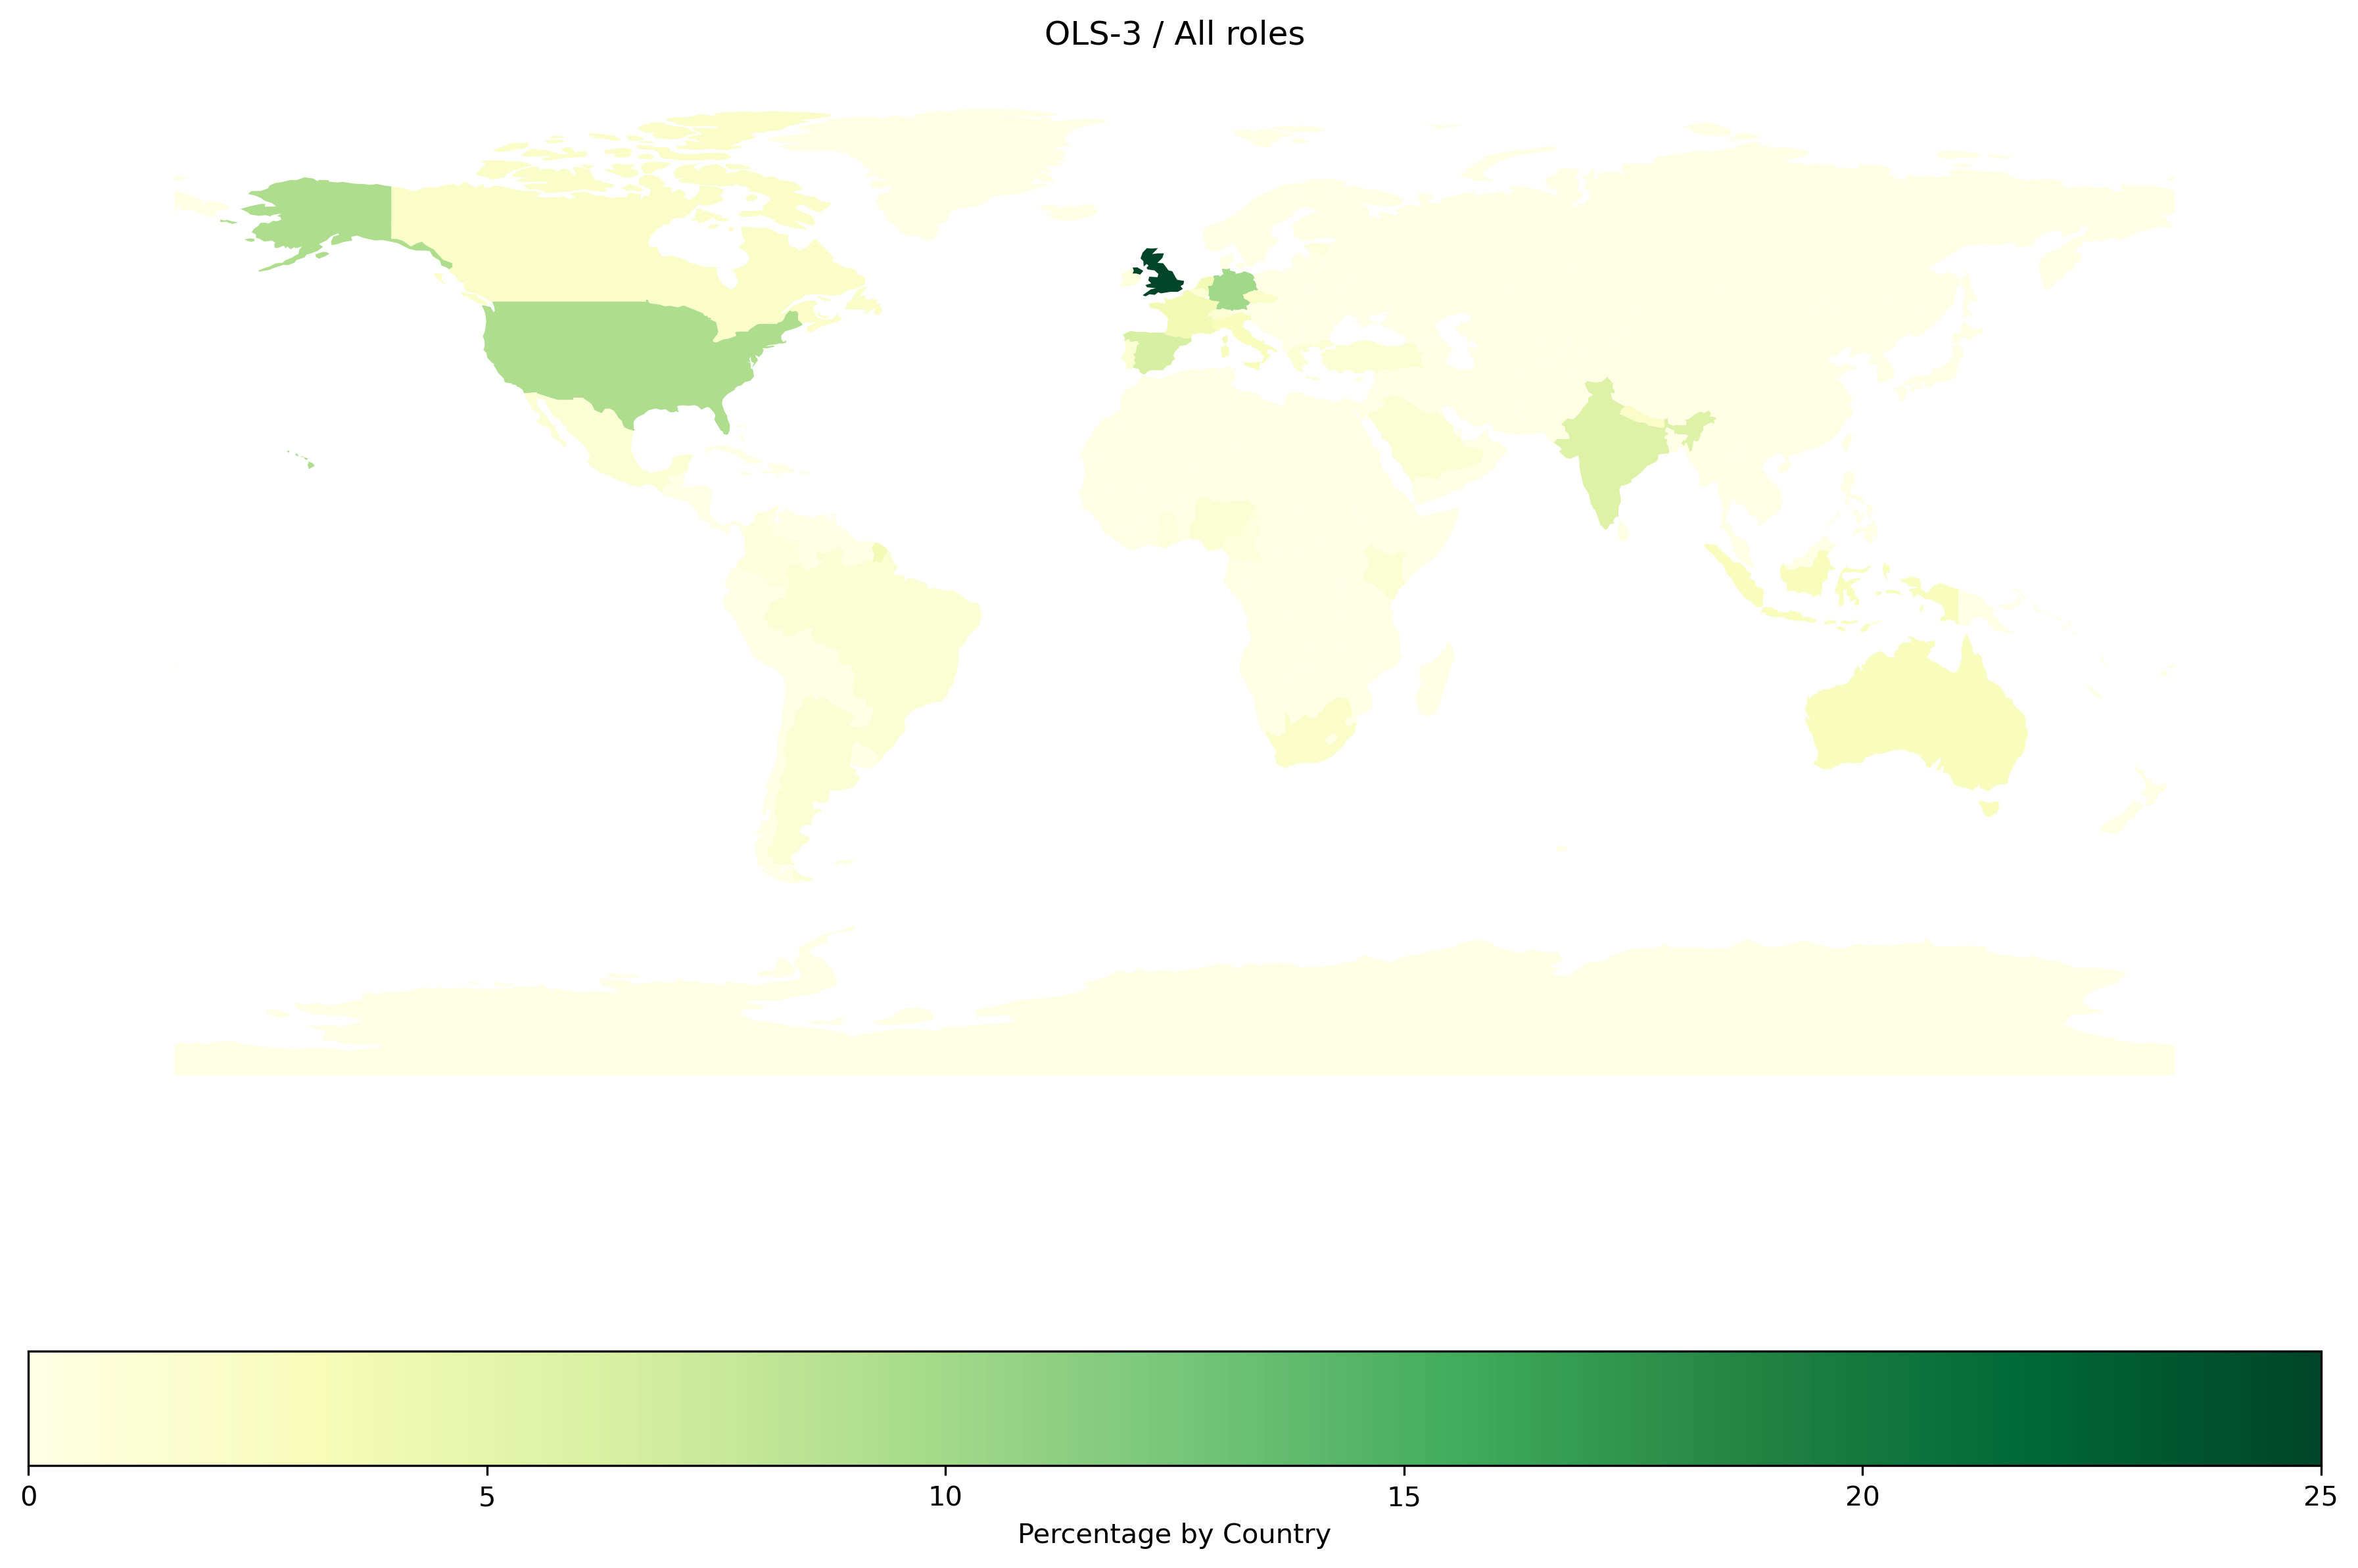
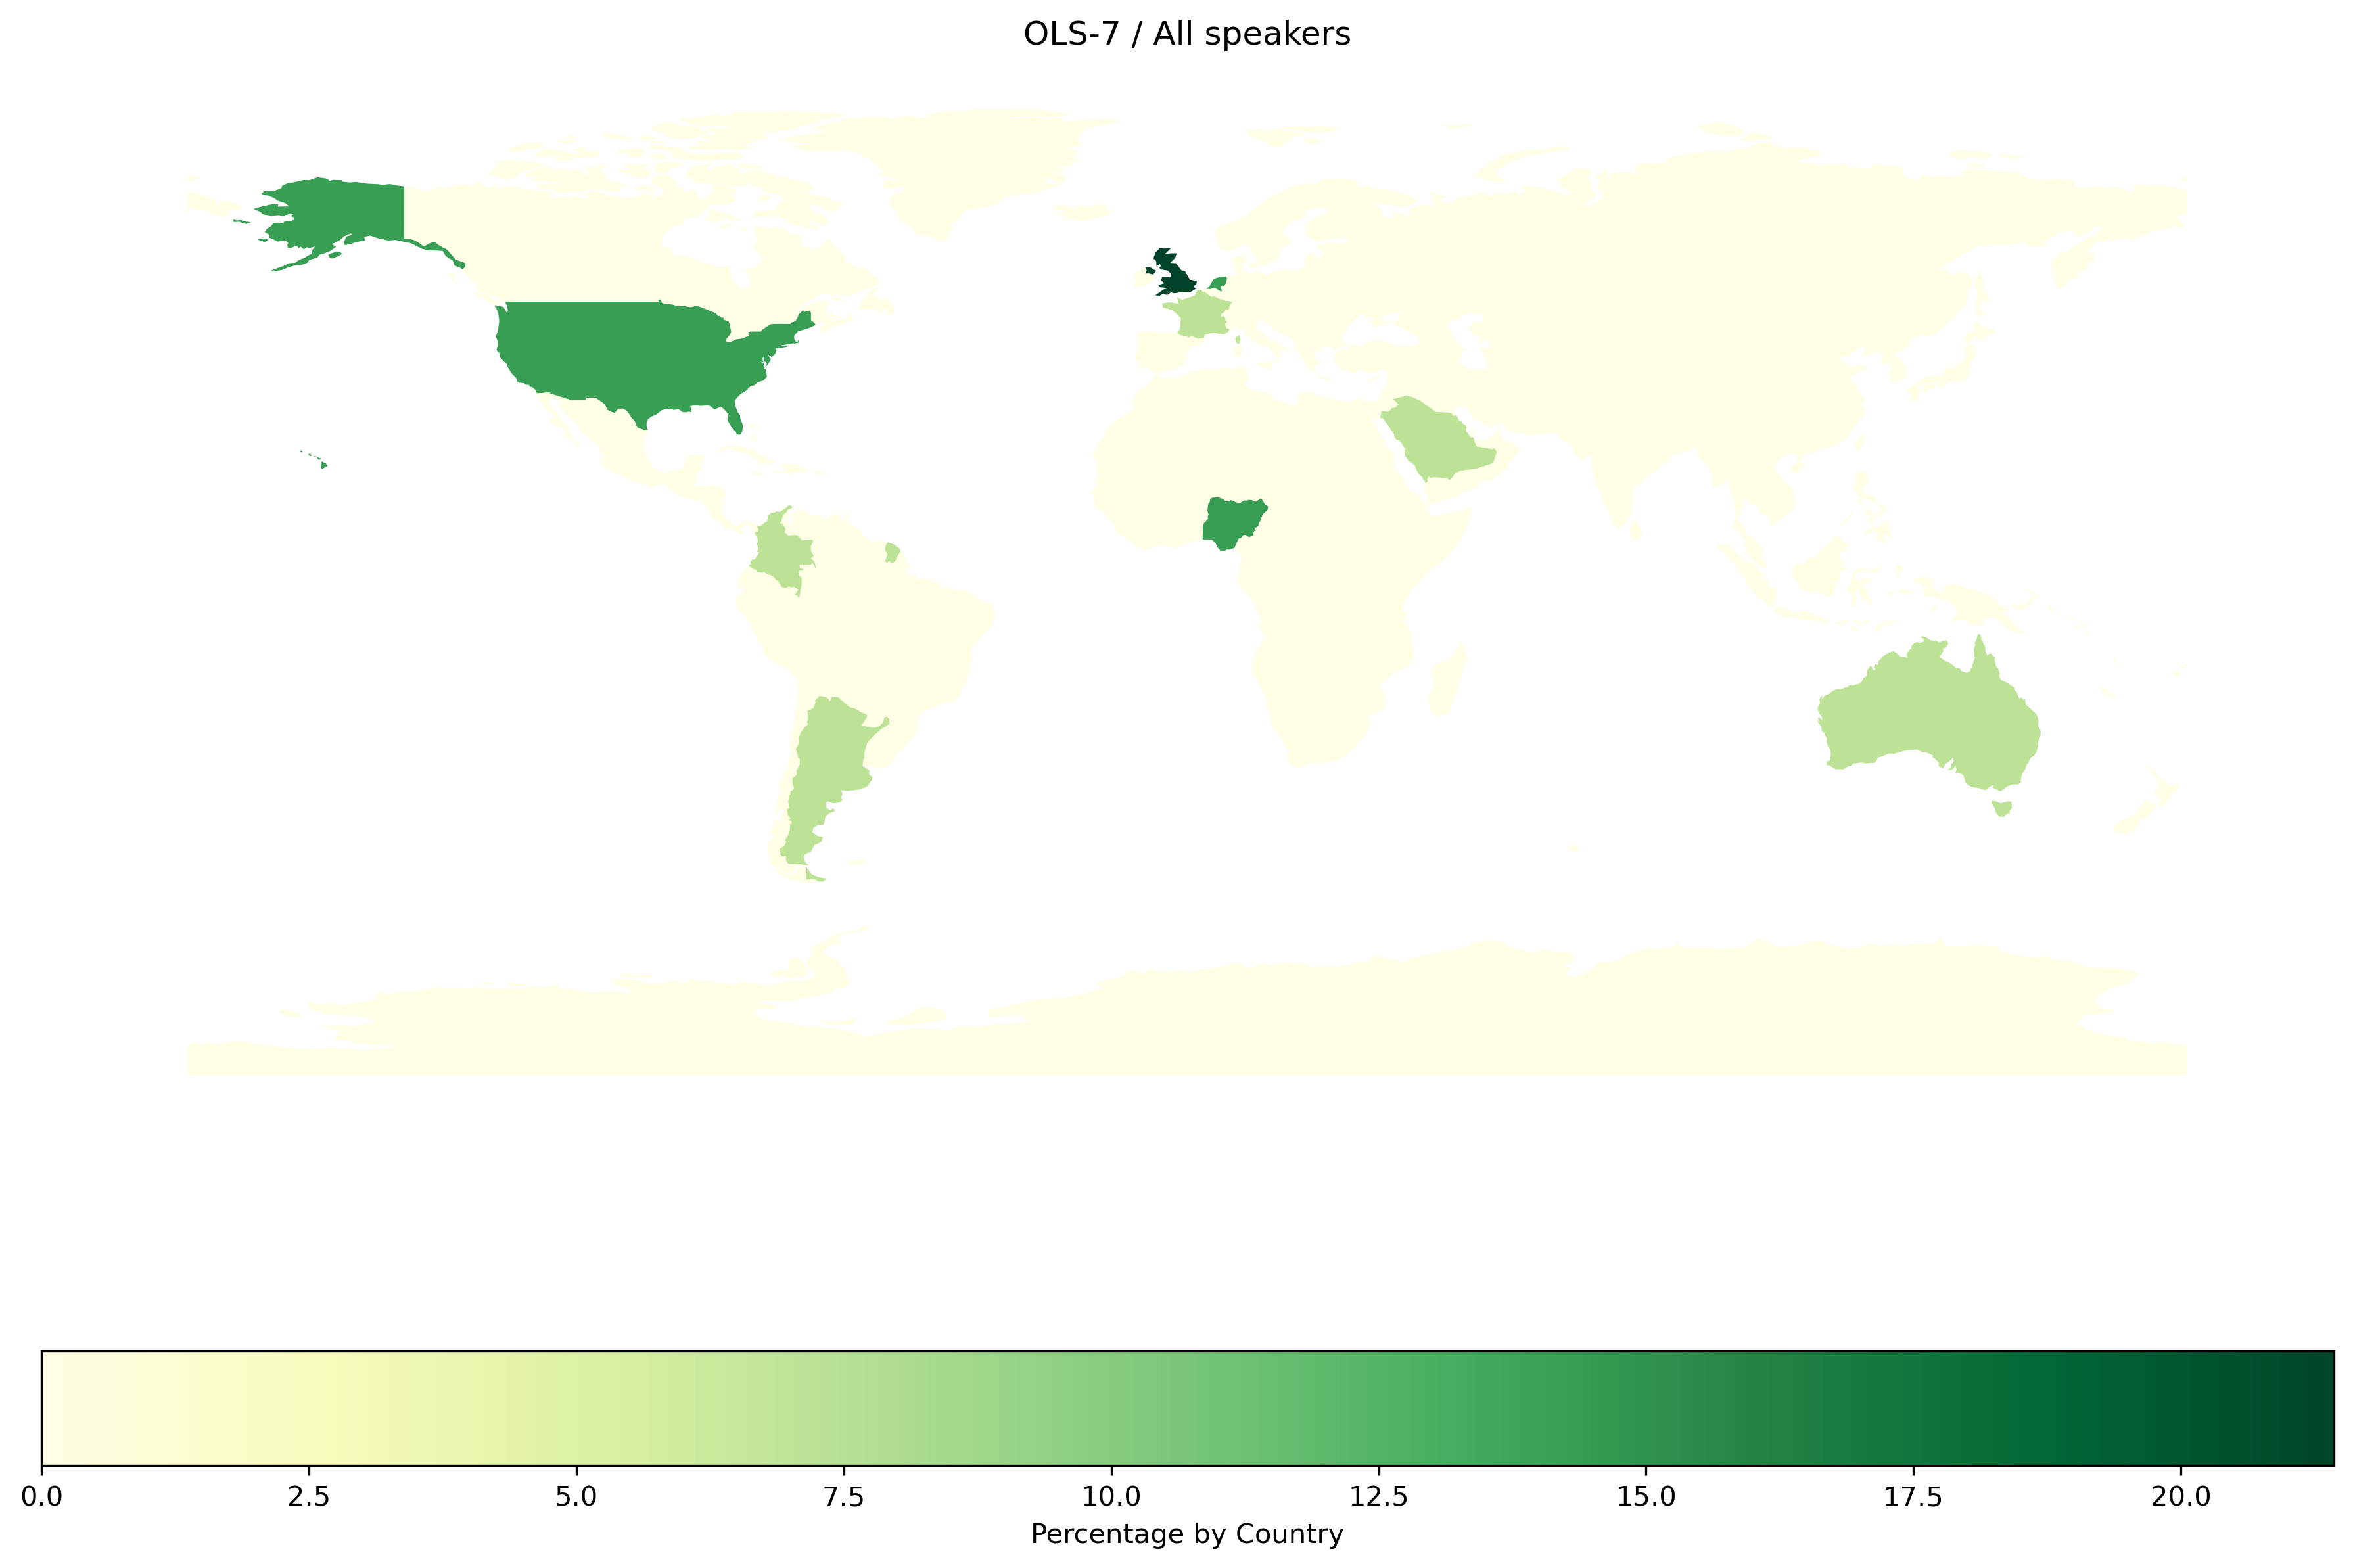
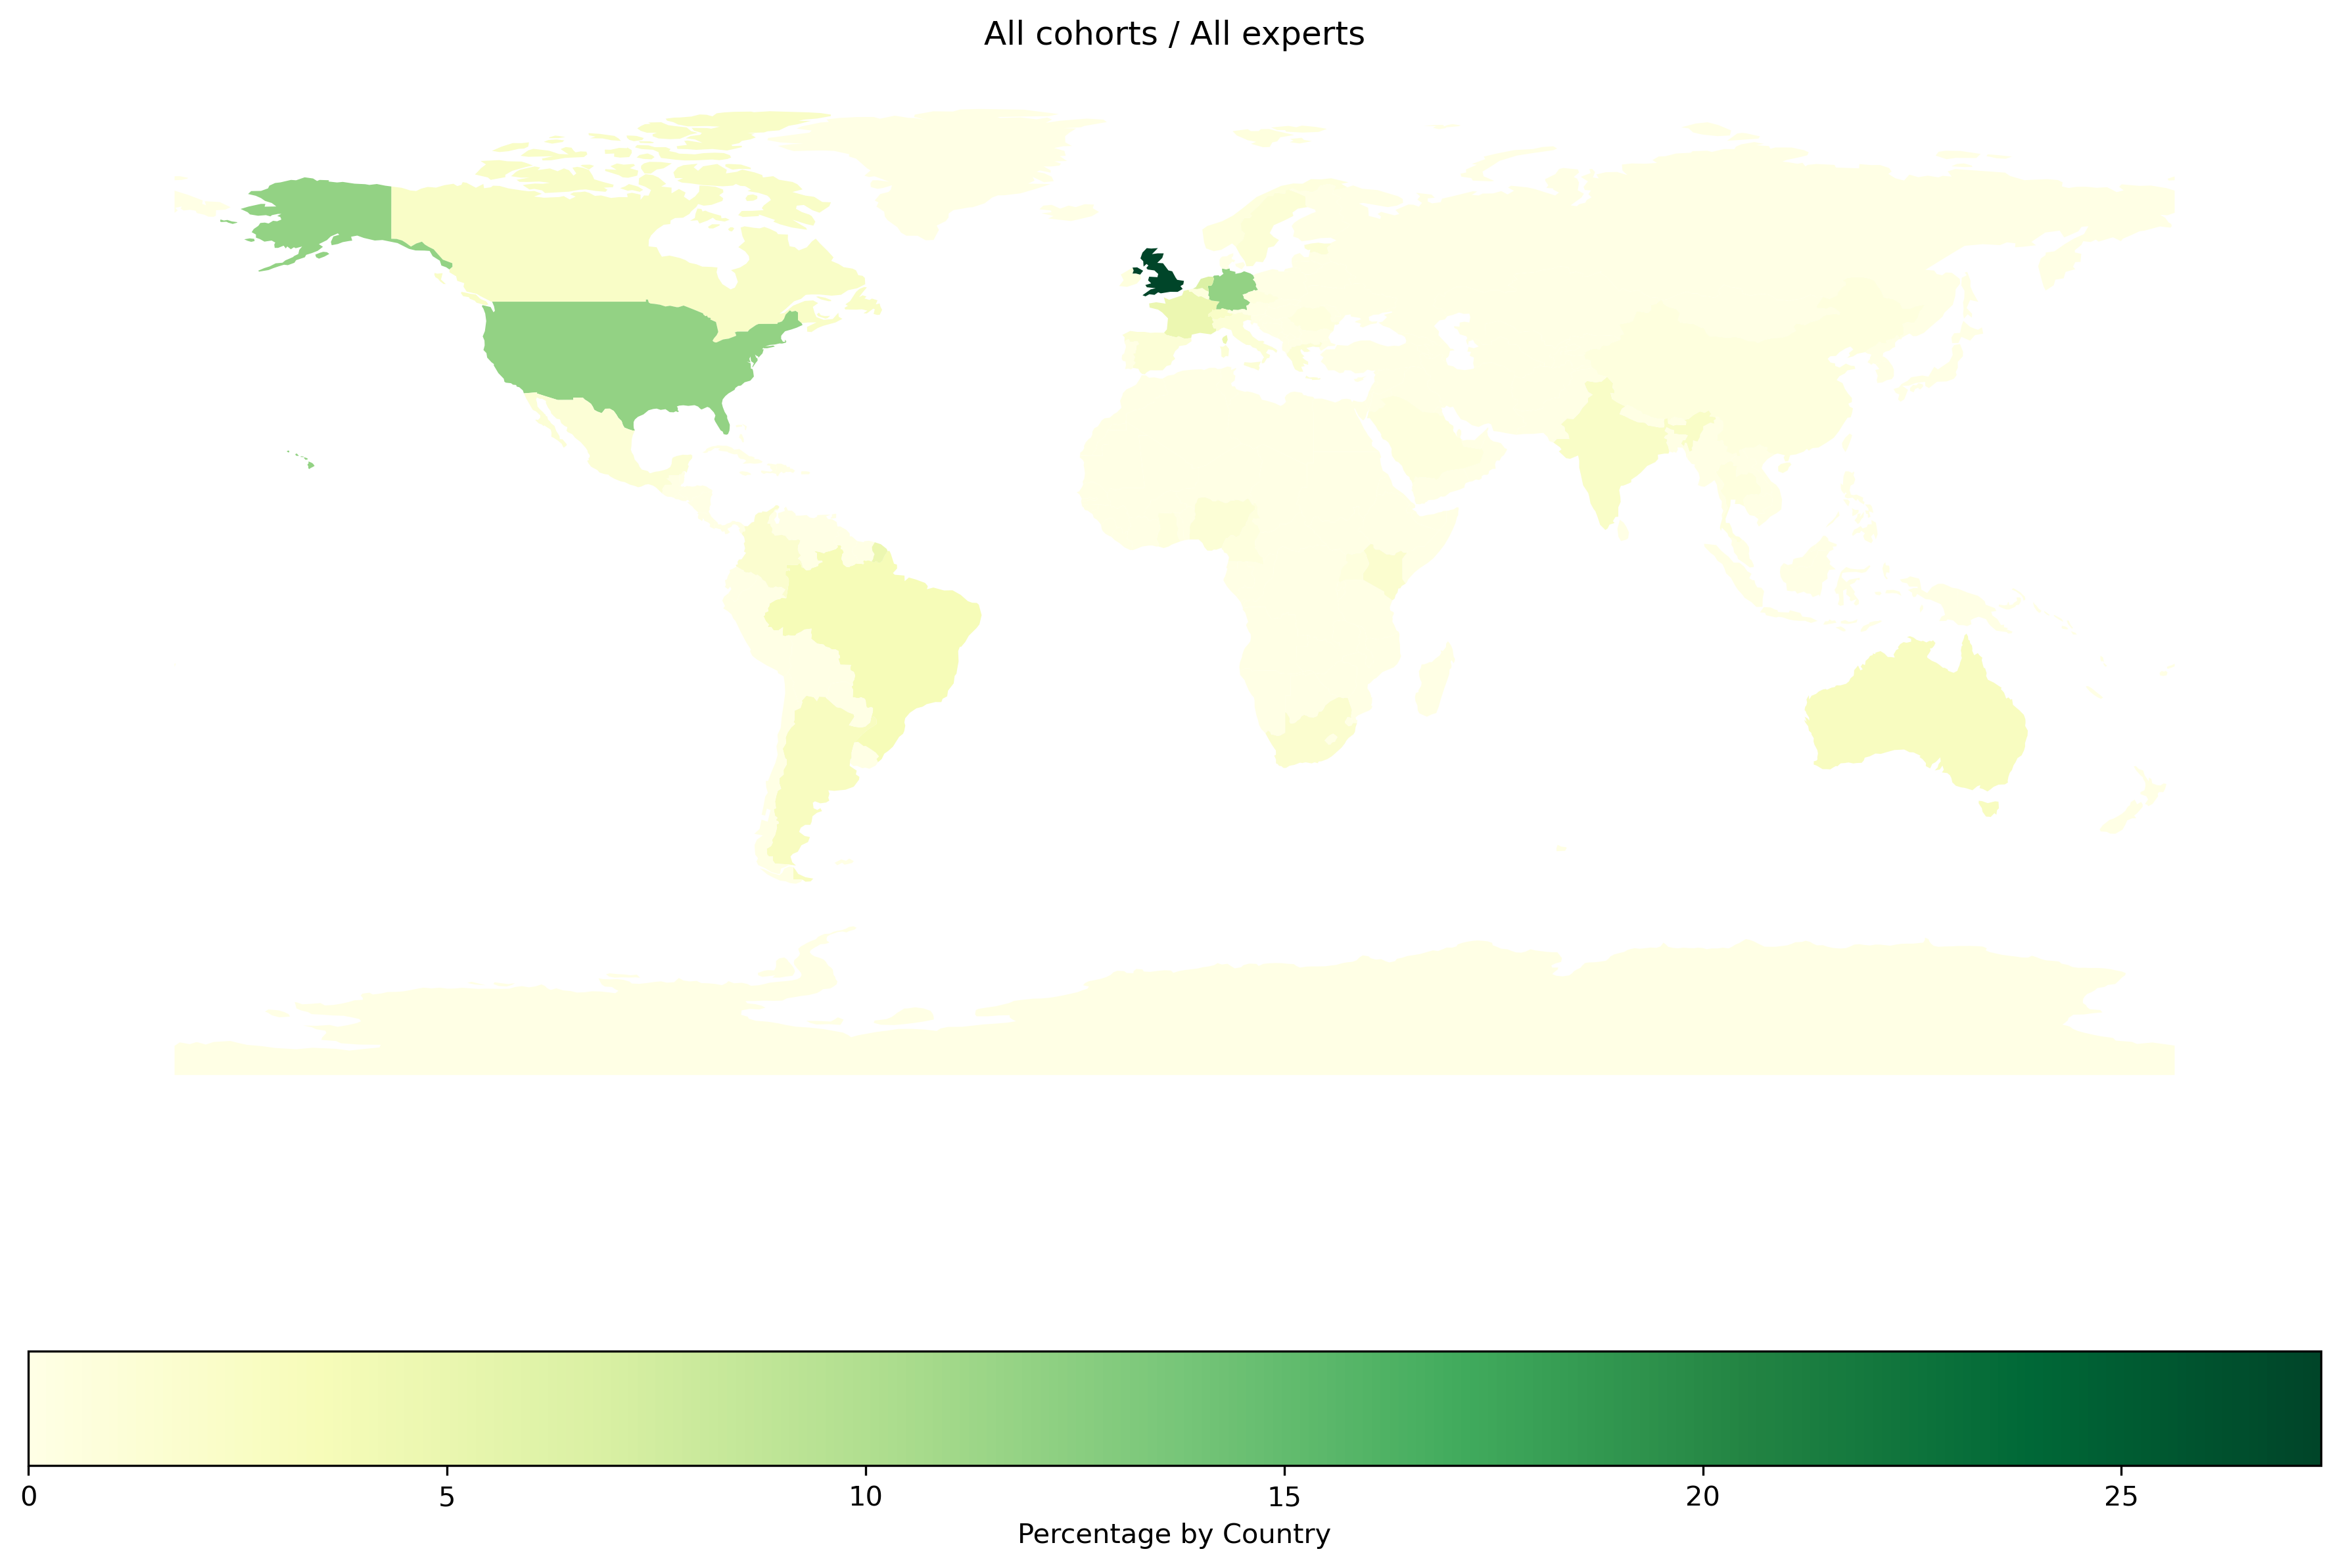
Countries
Proportion of people without country information
Country repartition
|
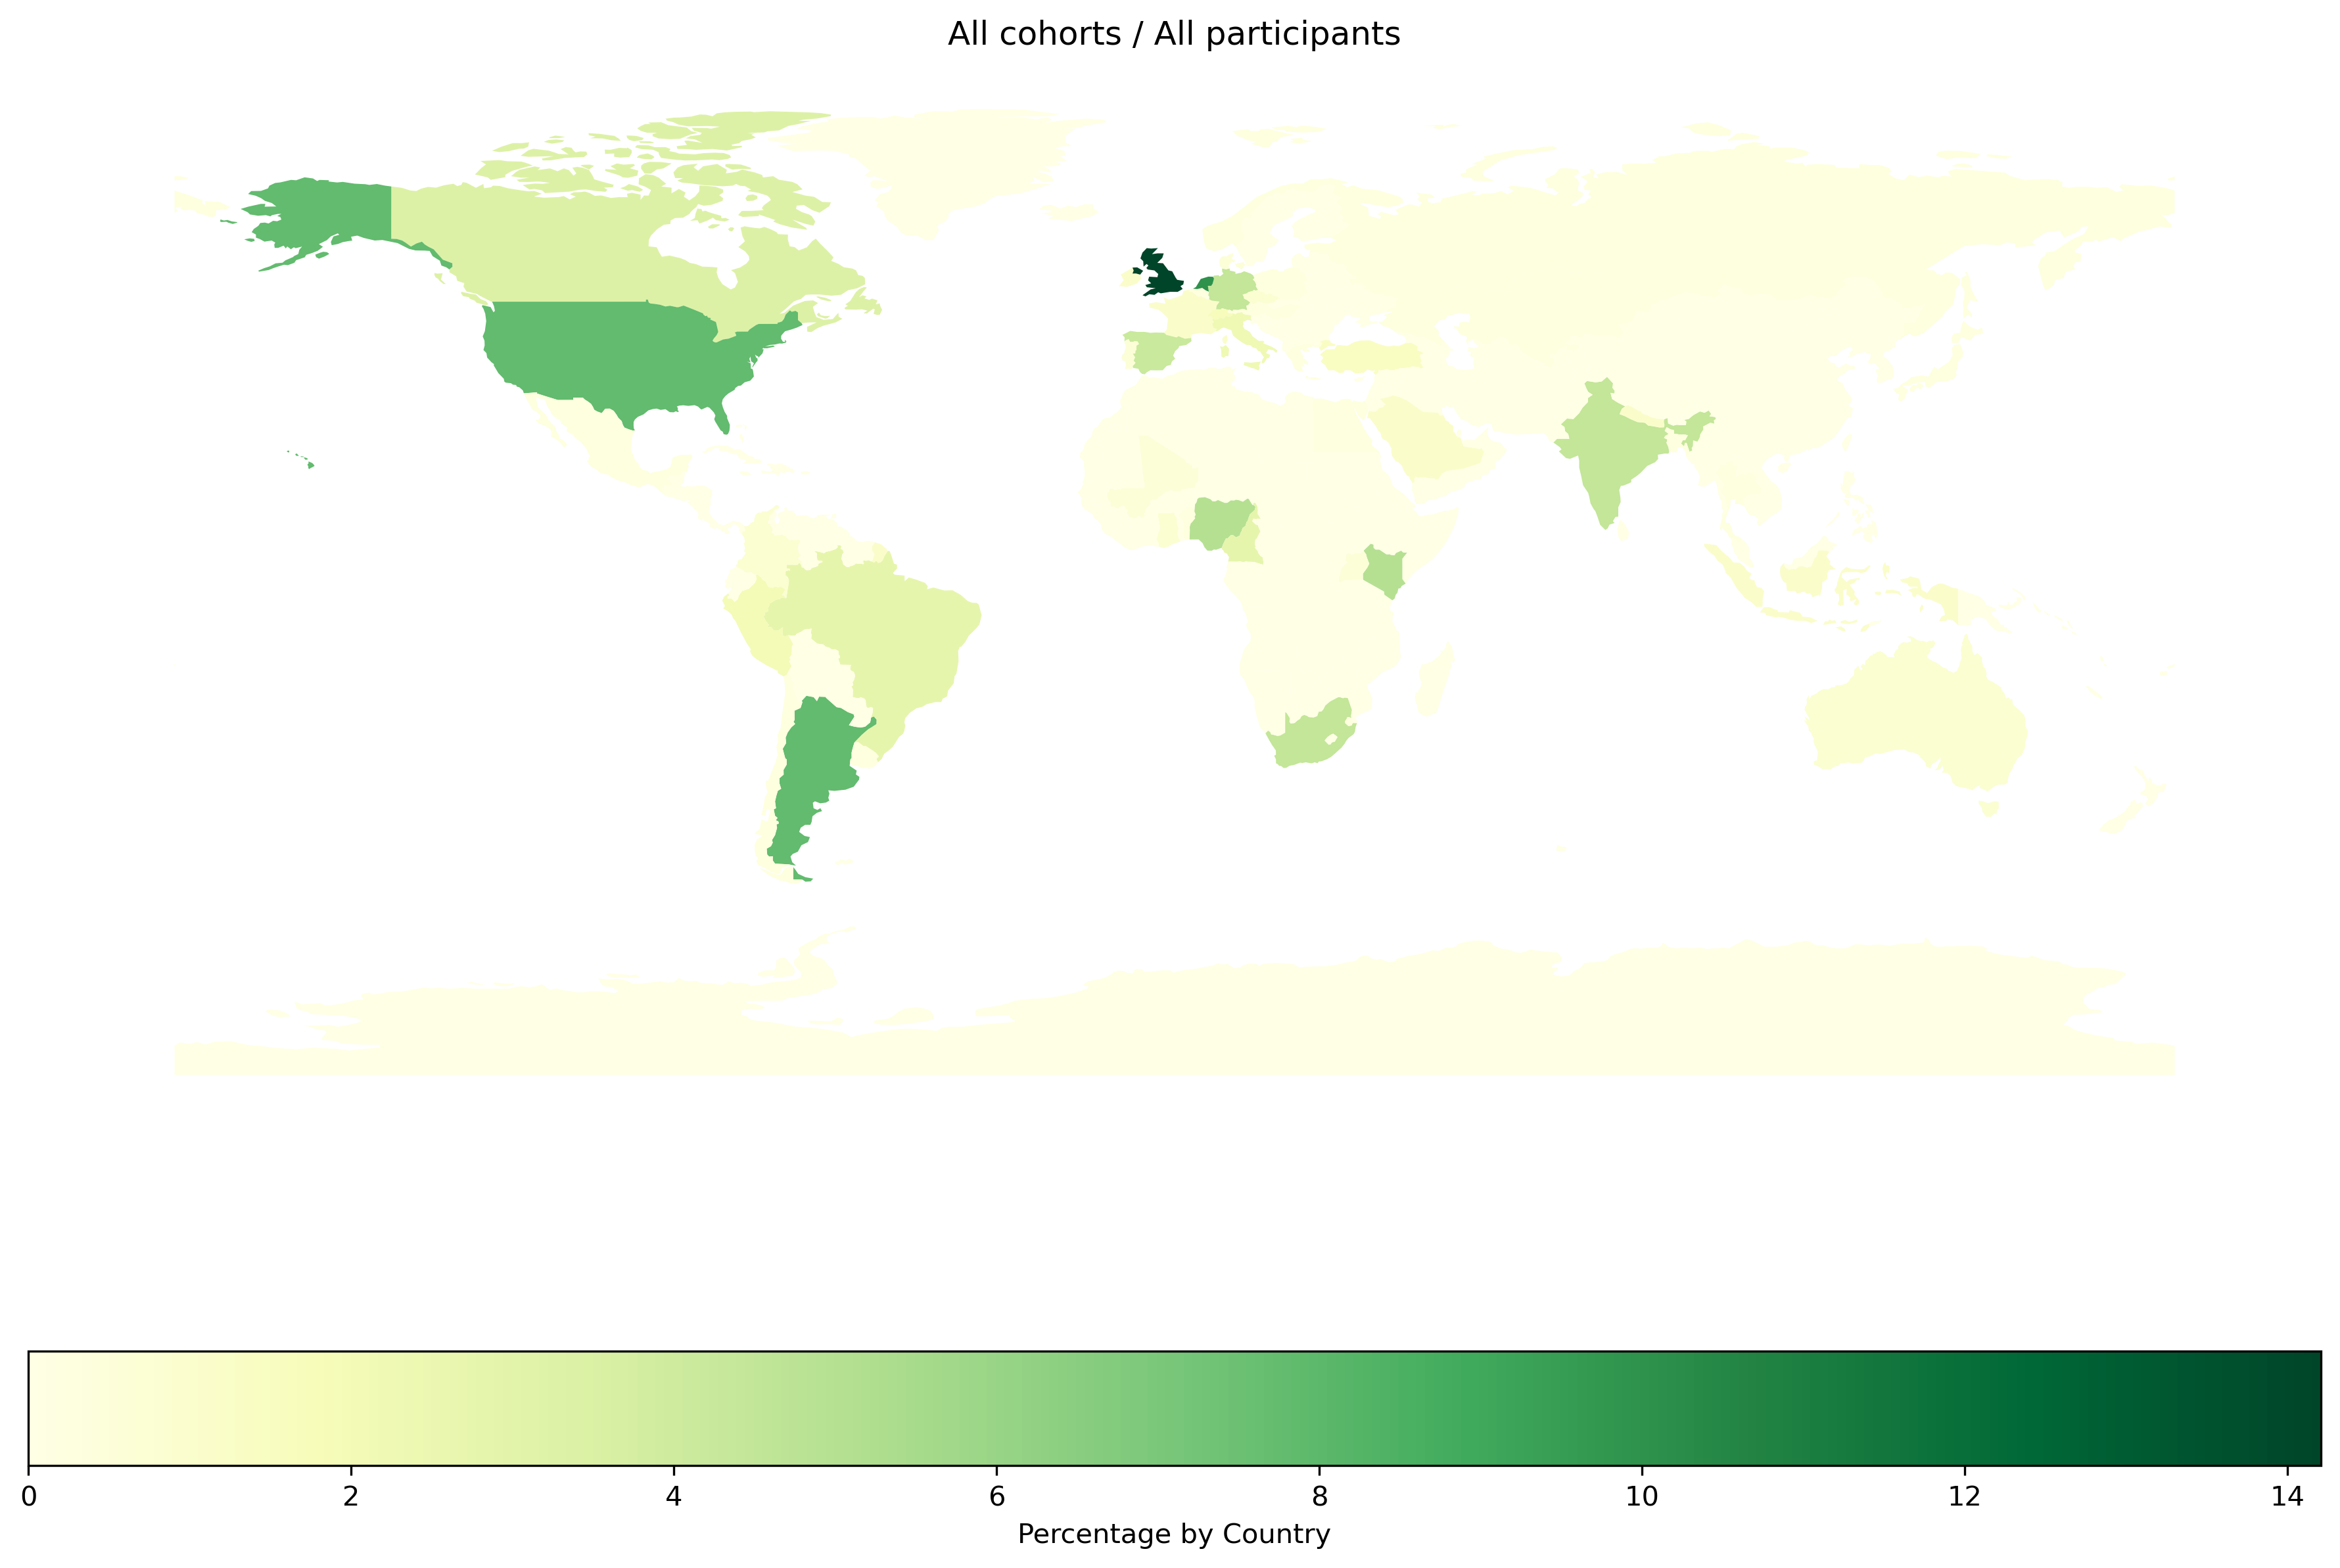
TOTAL |
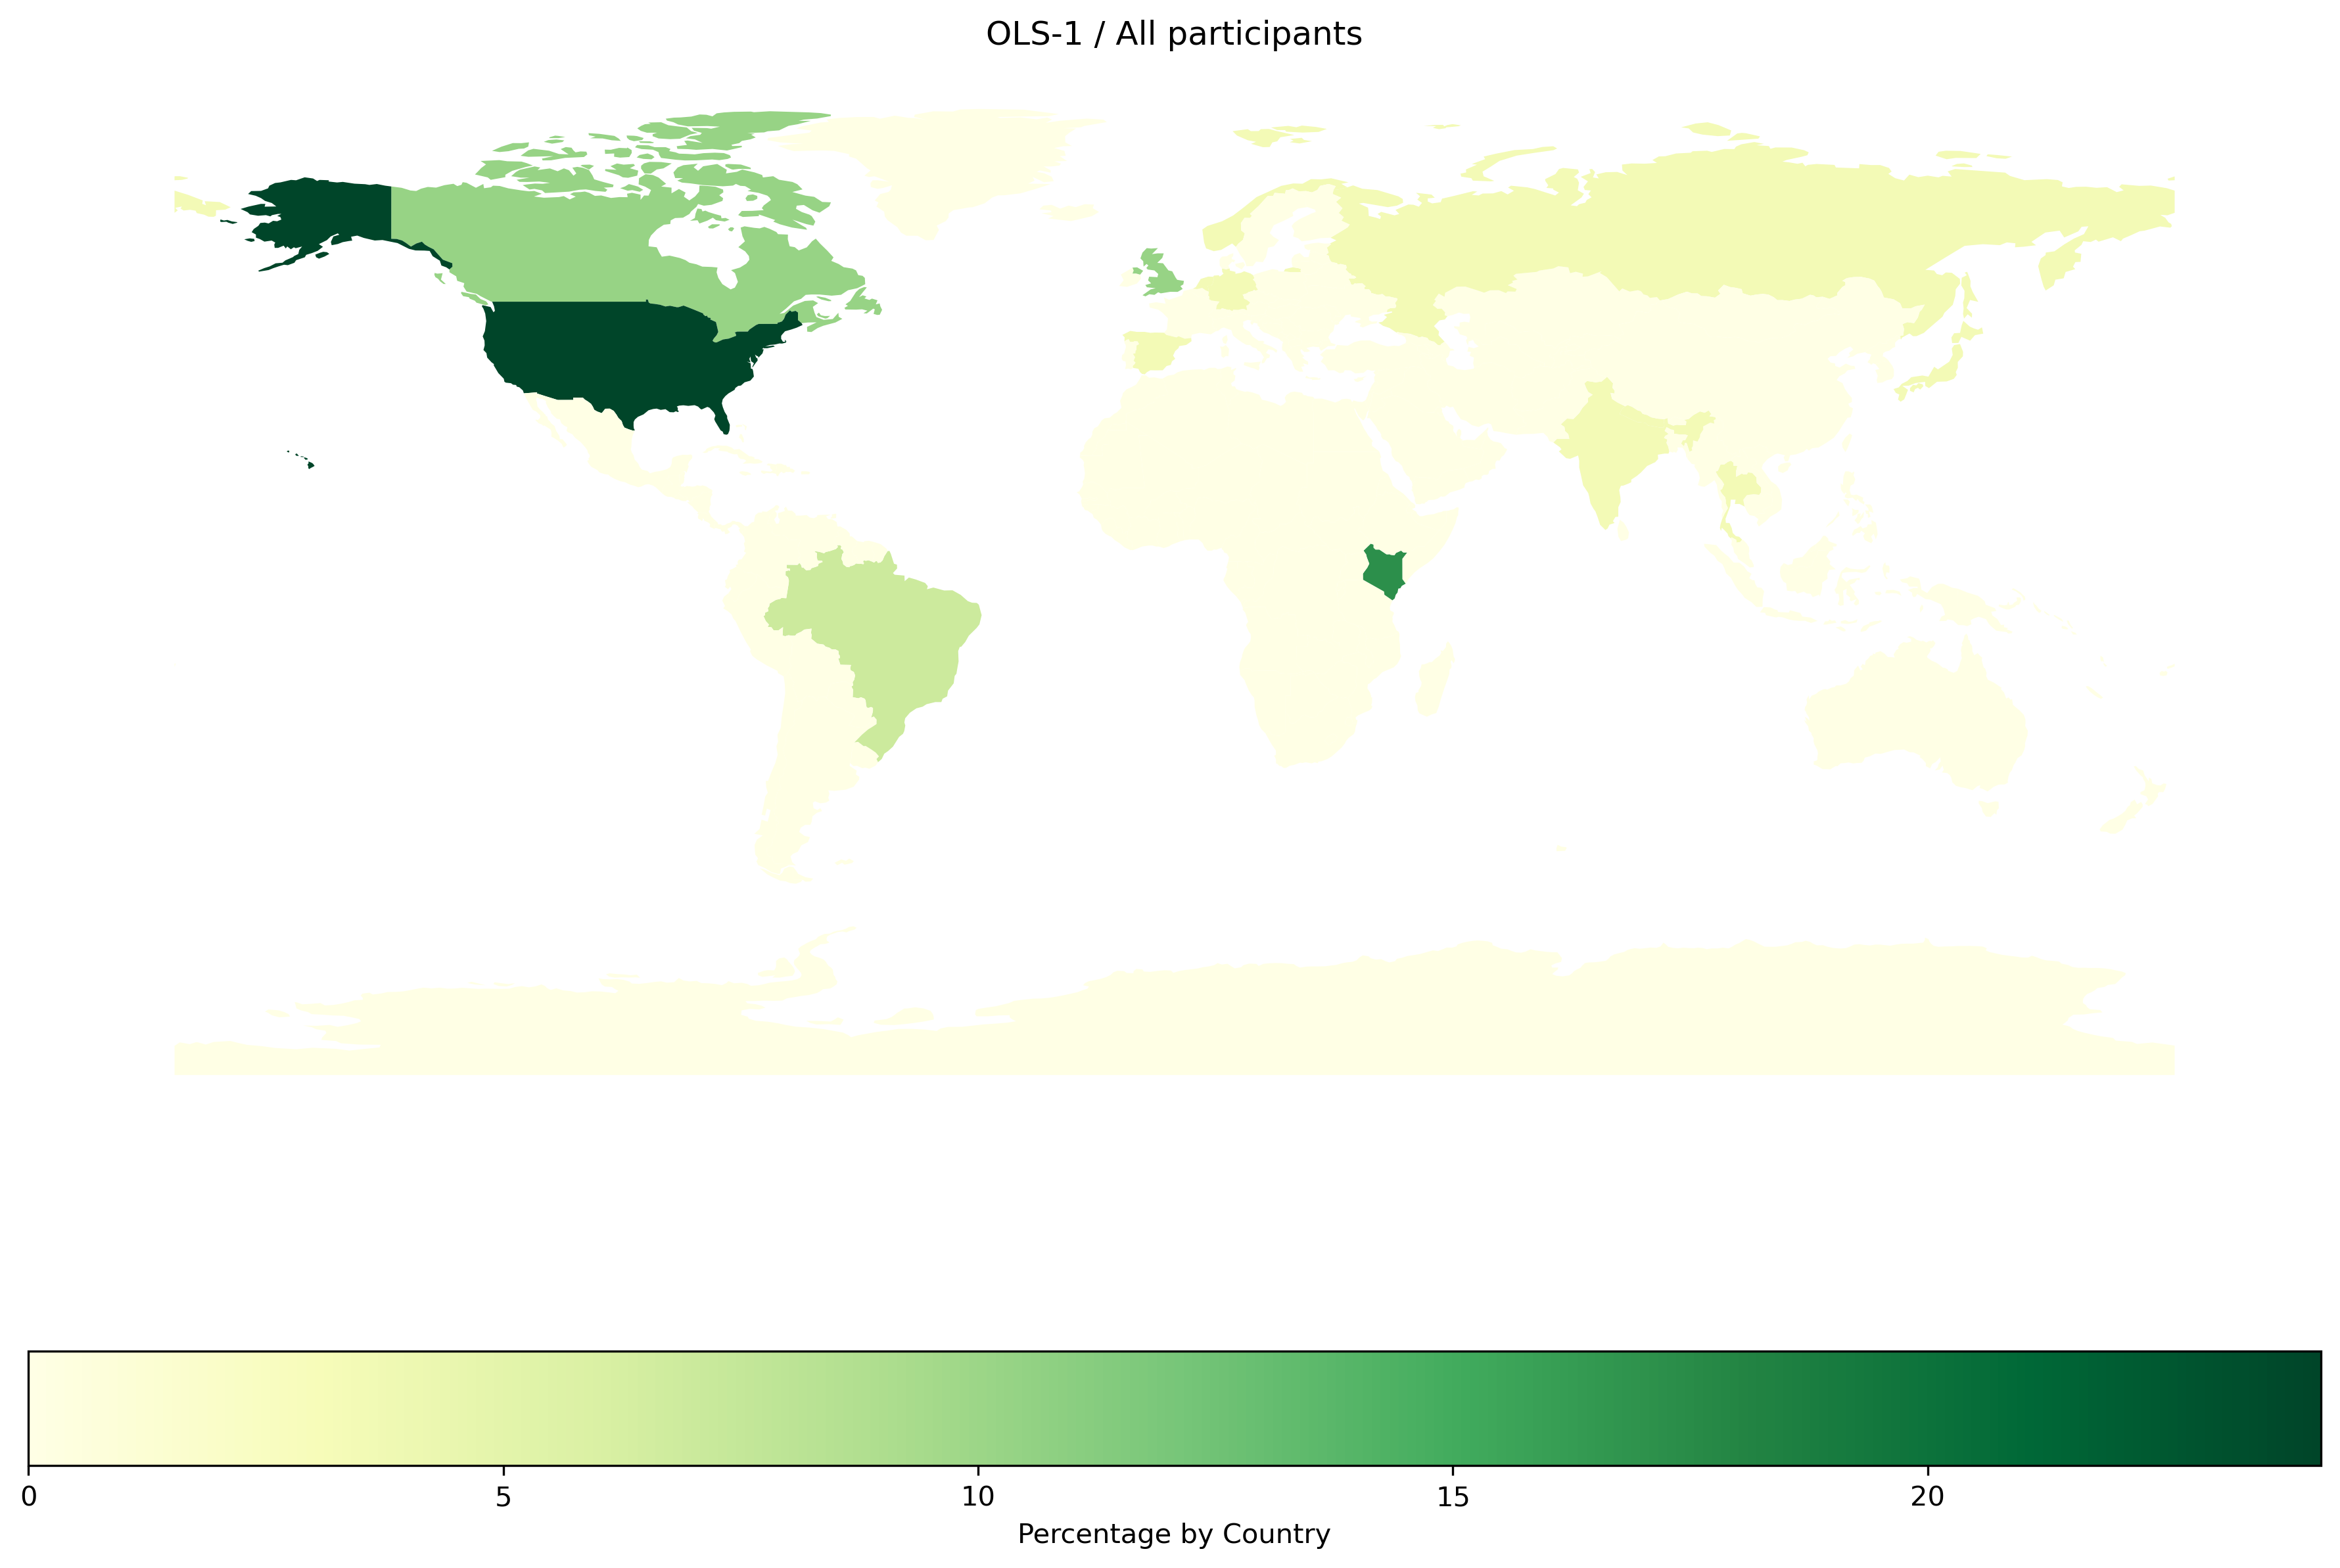
OLS-1 |
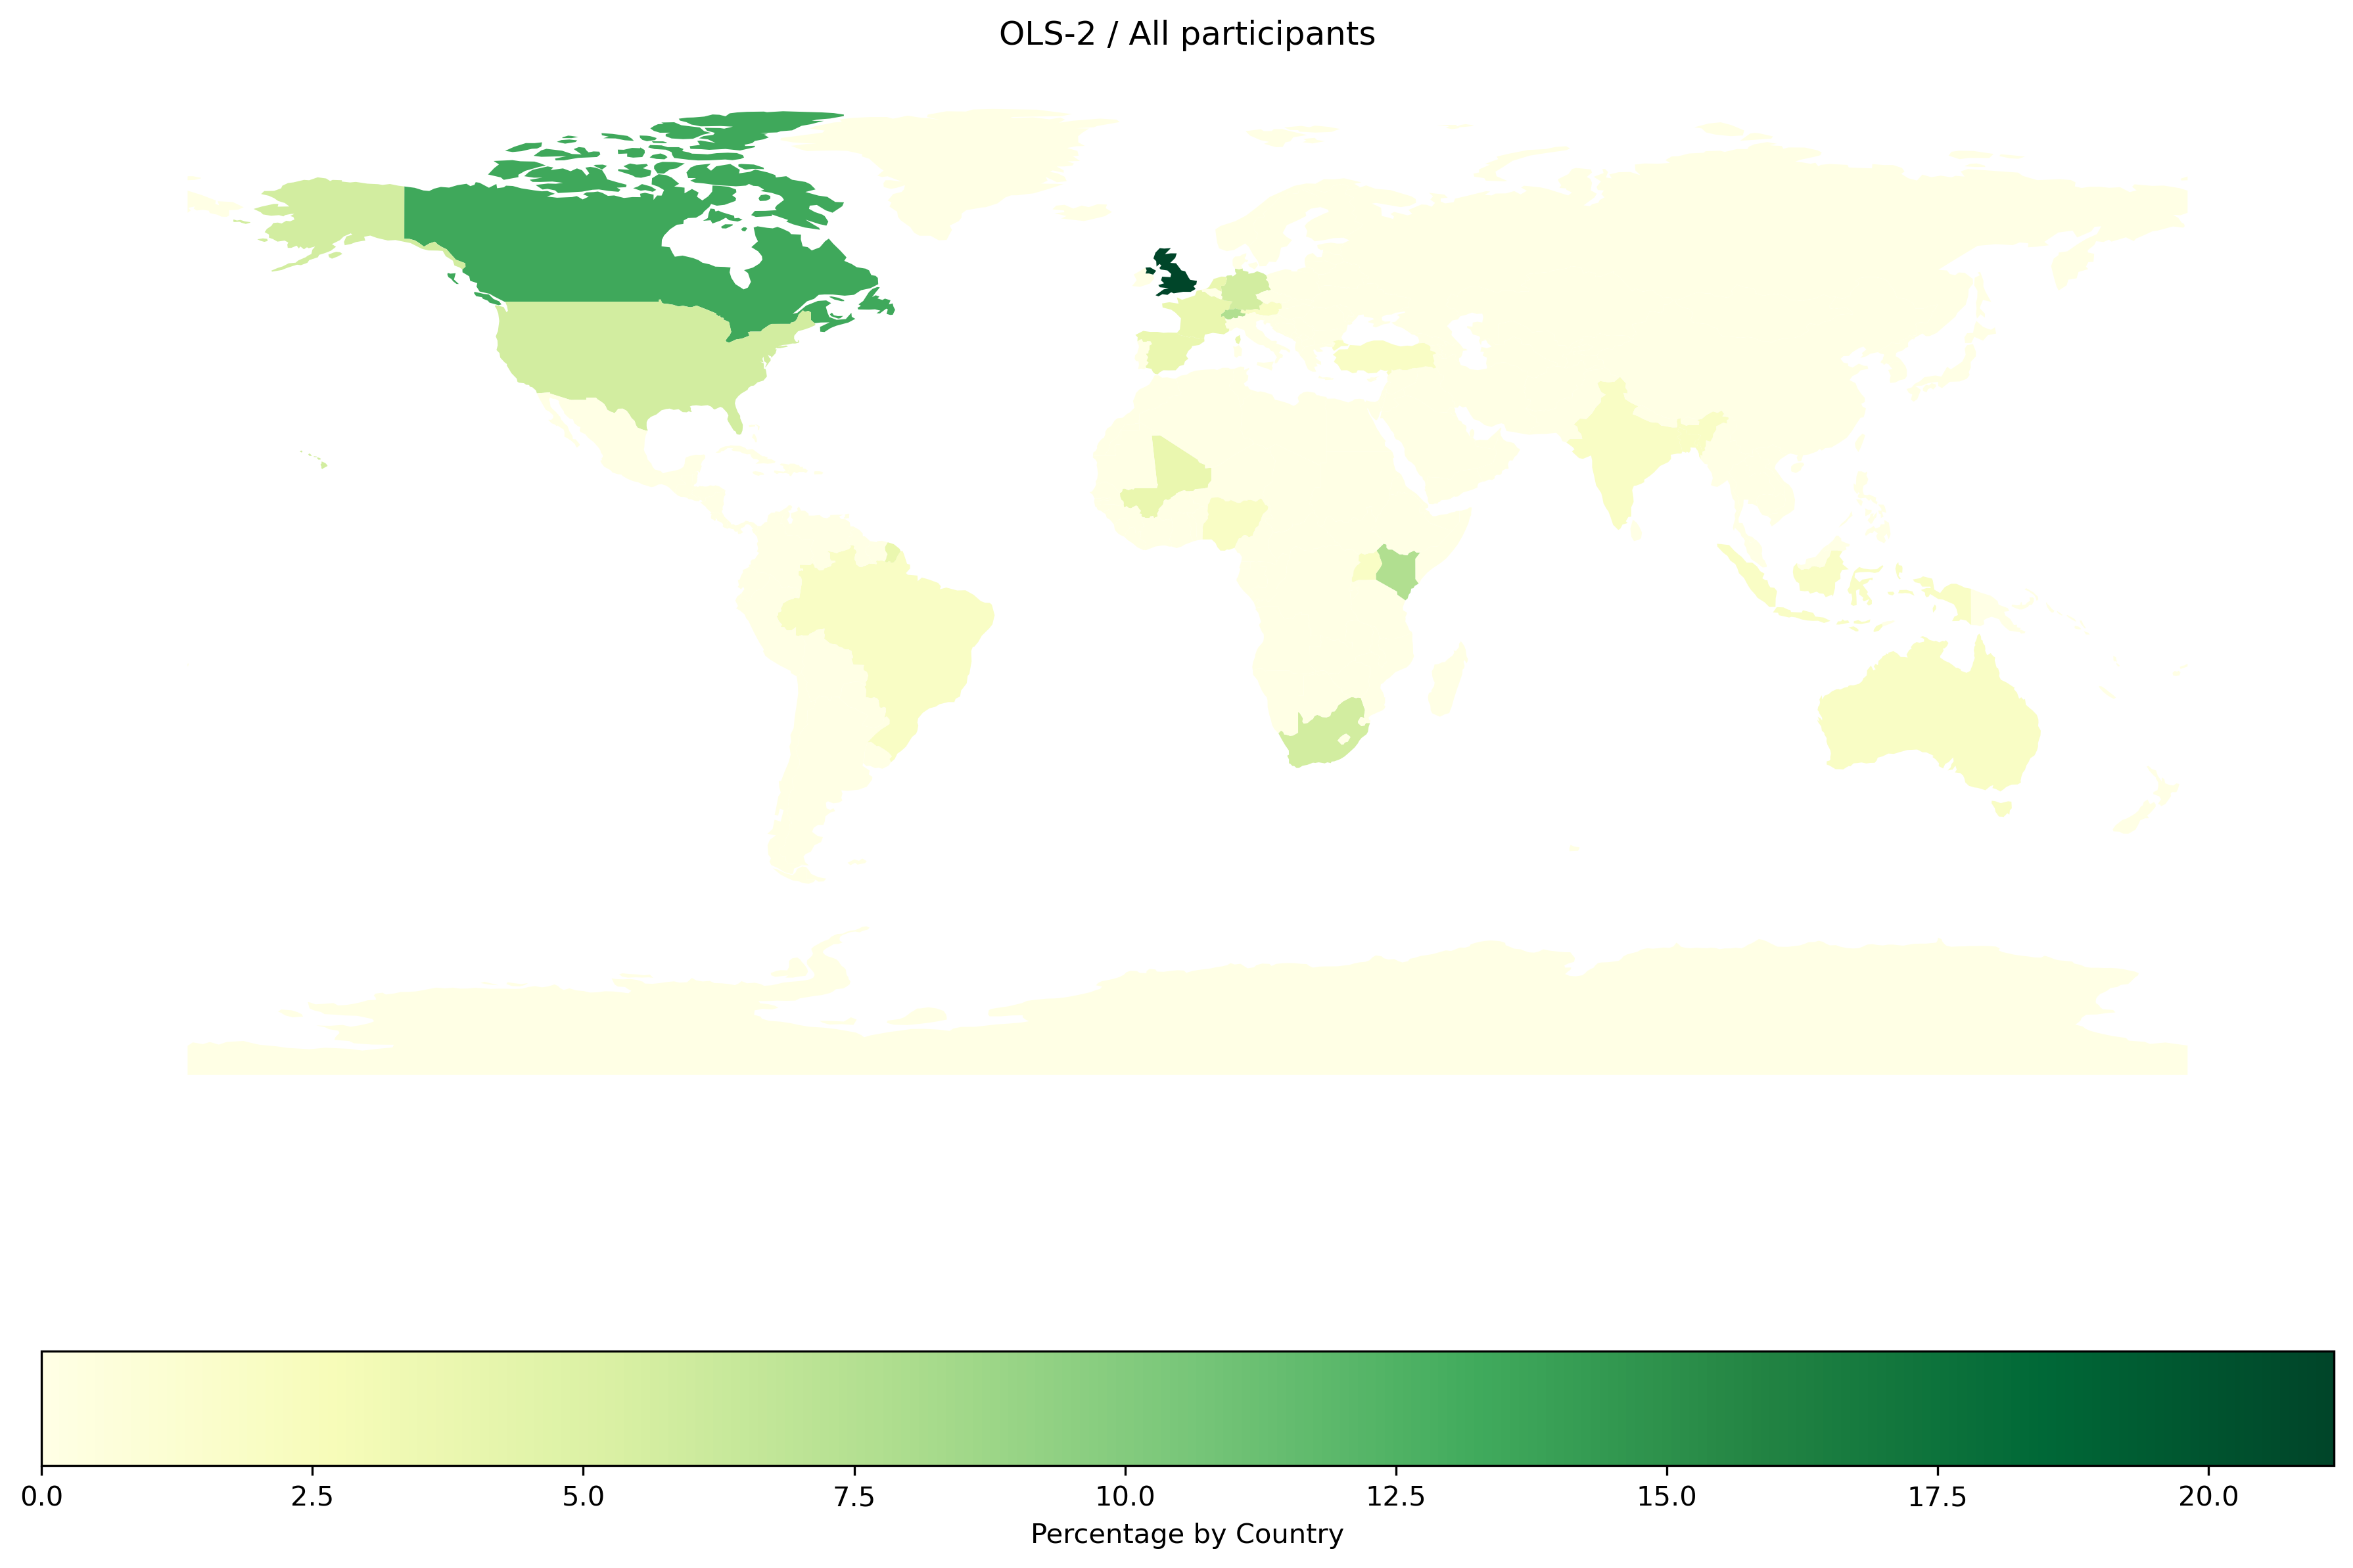
OLS-2 |
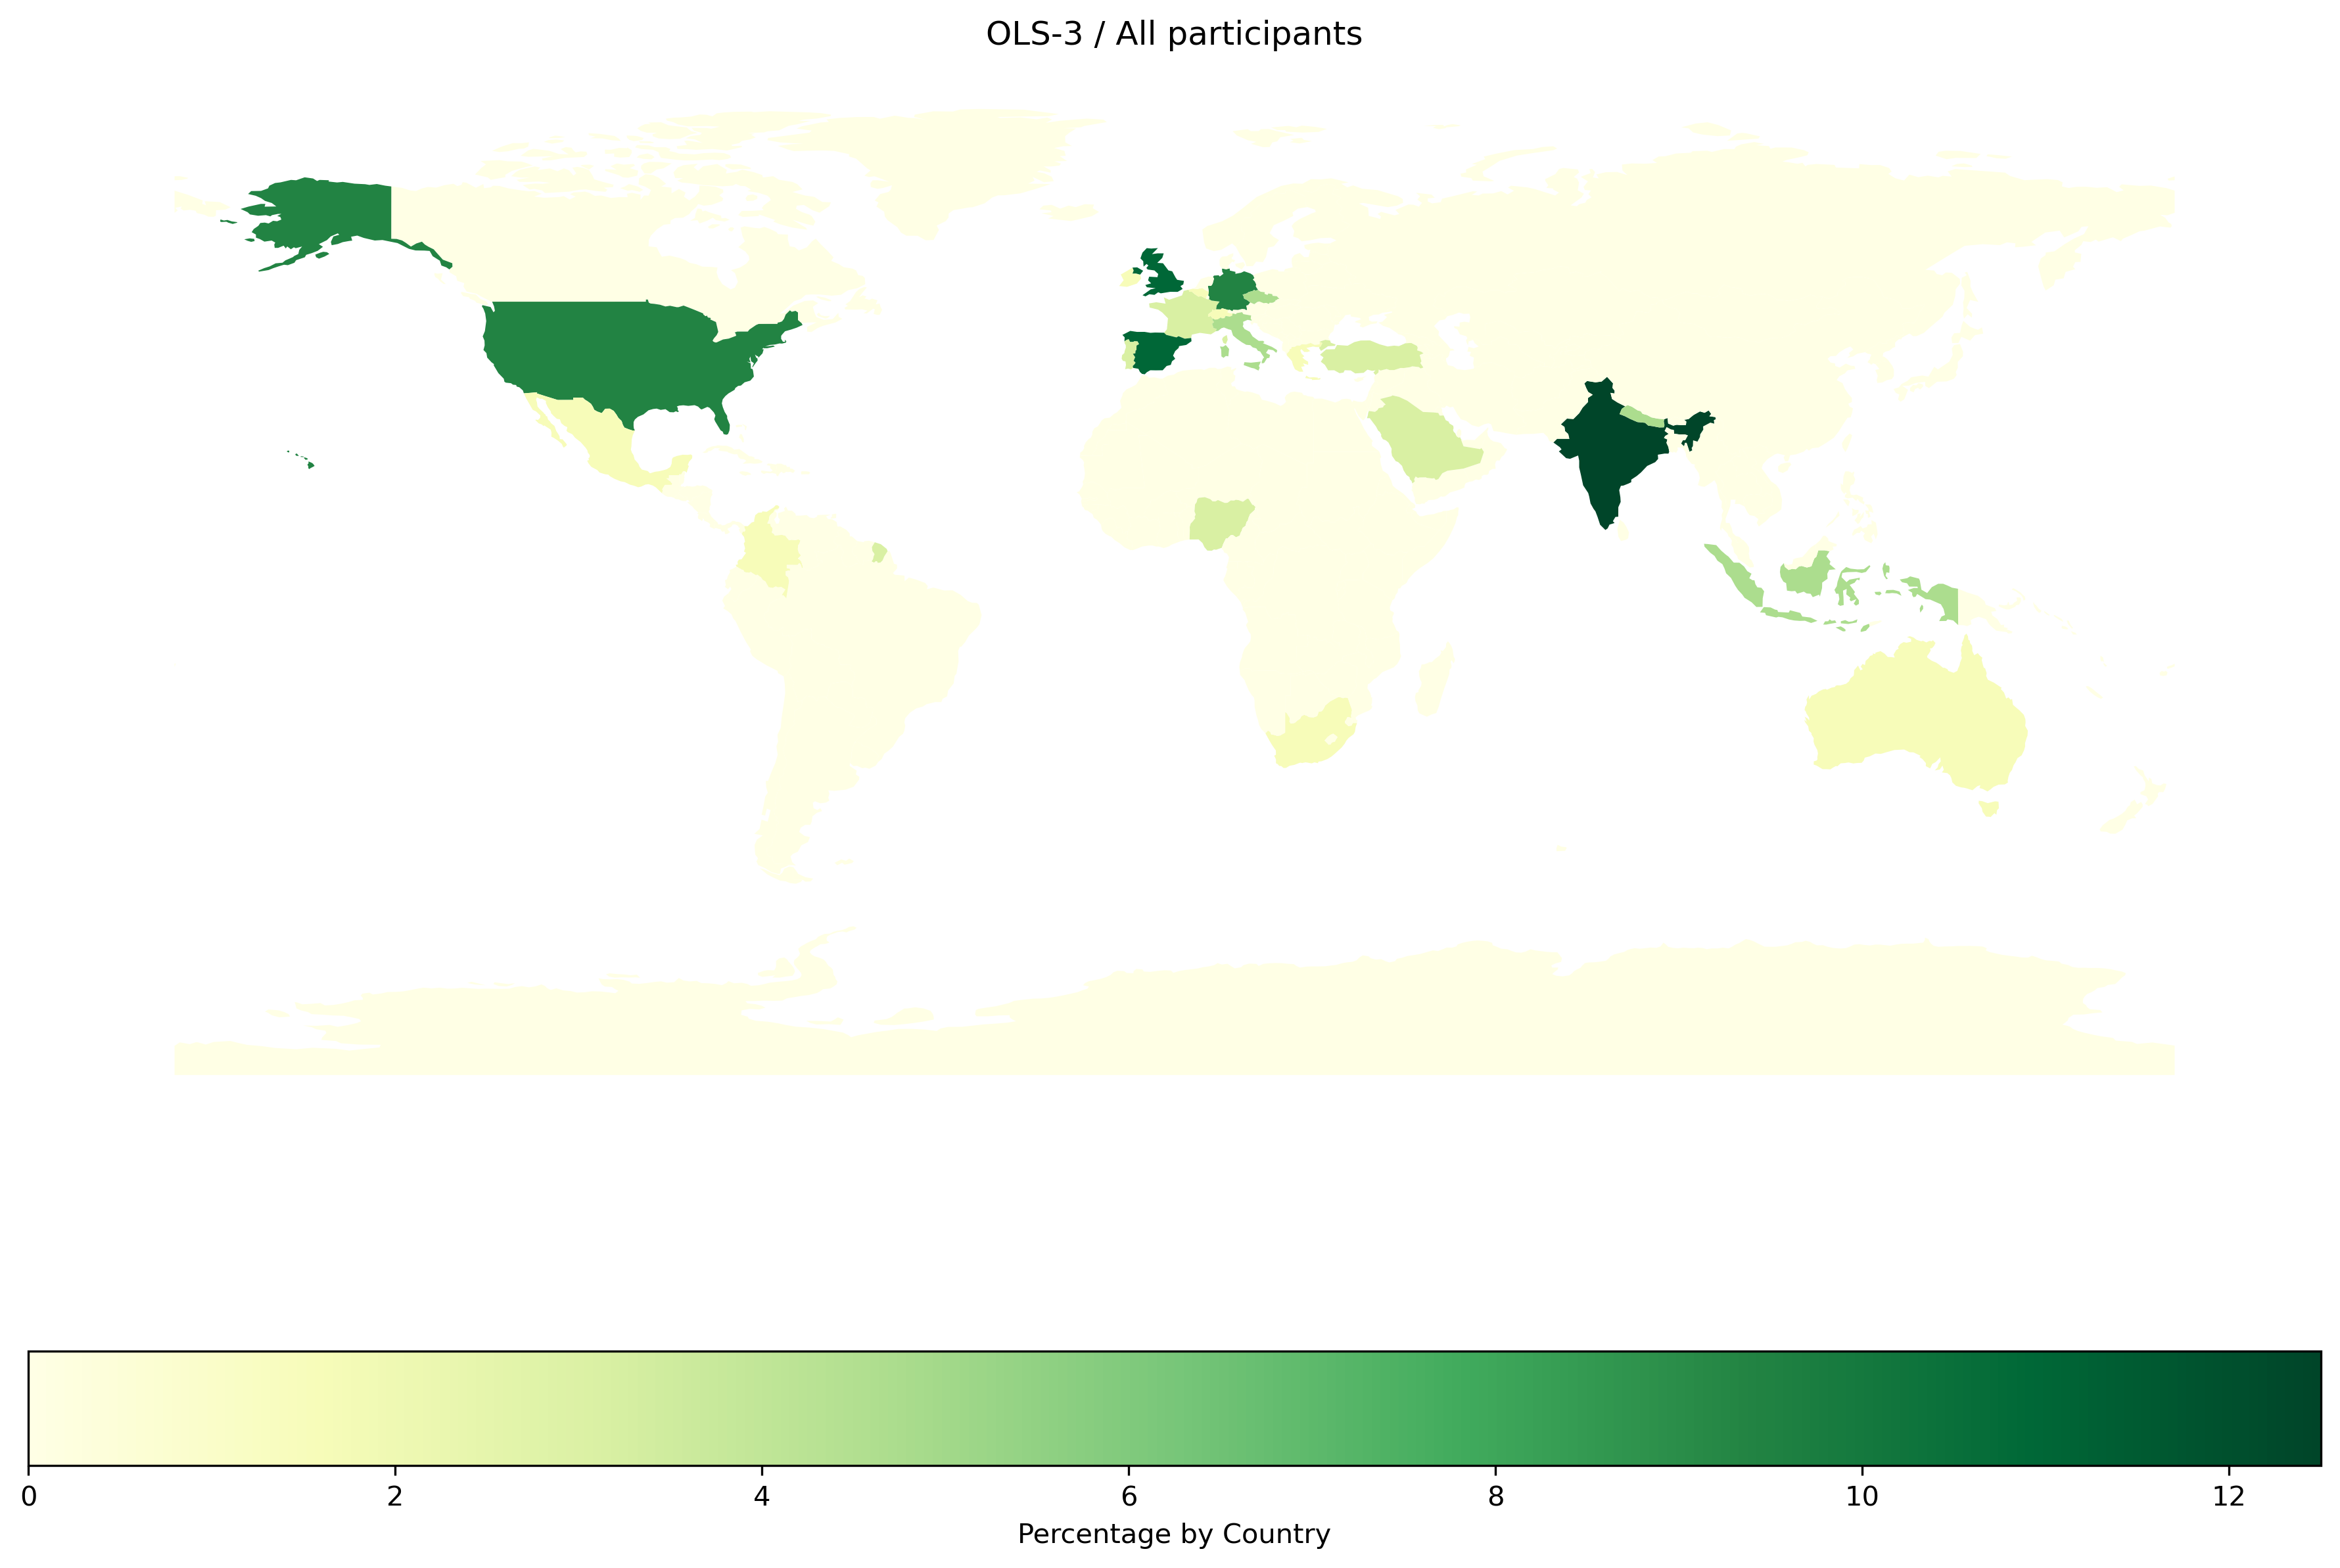
OLS-3 |
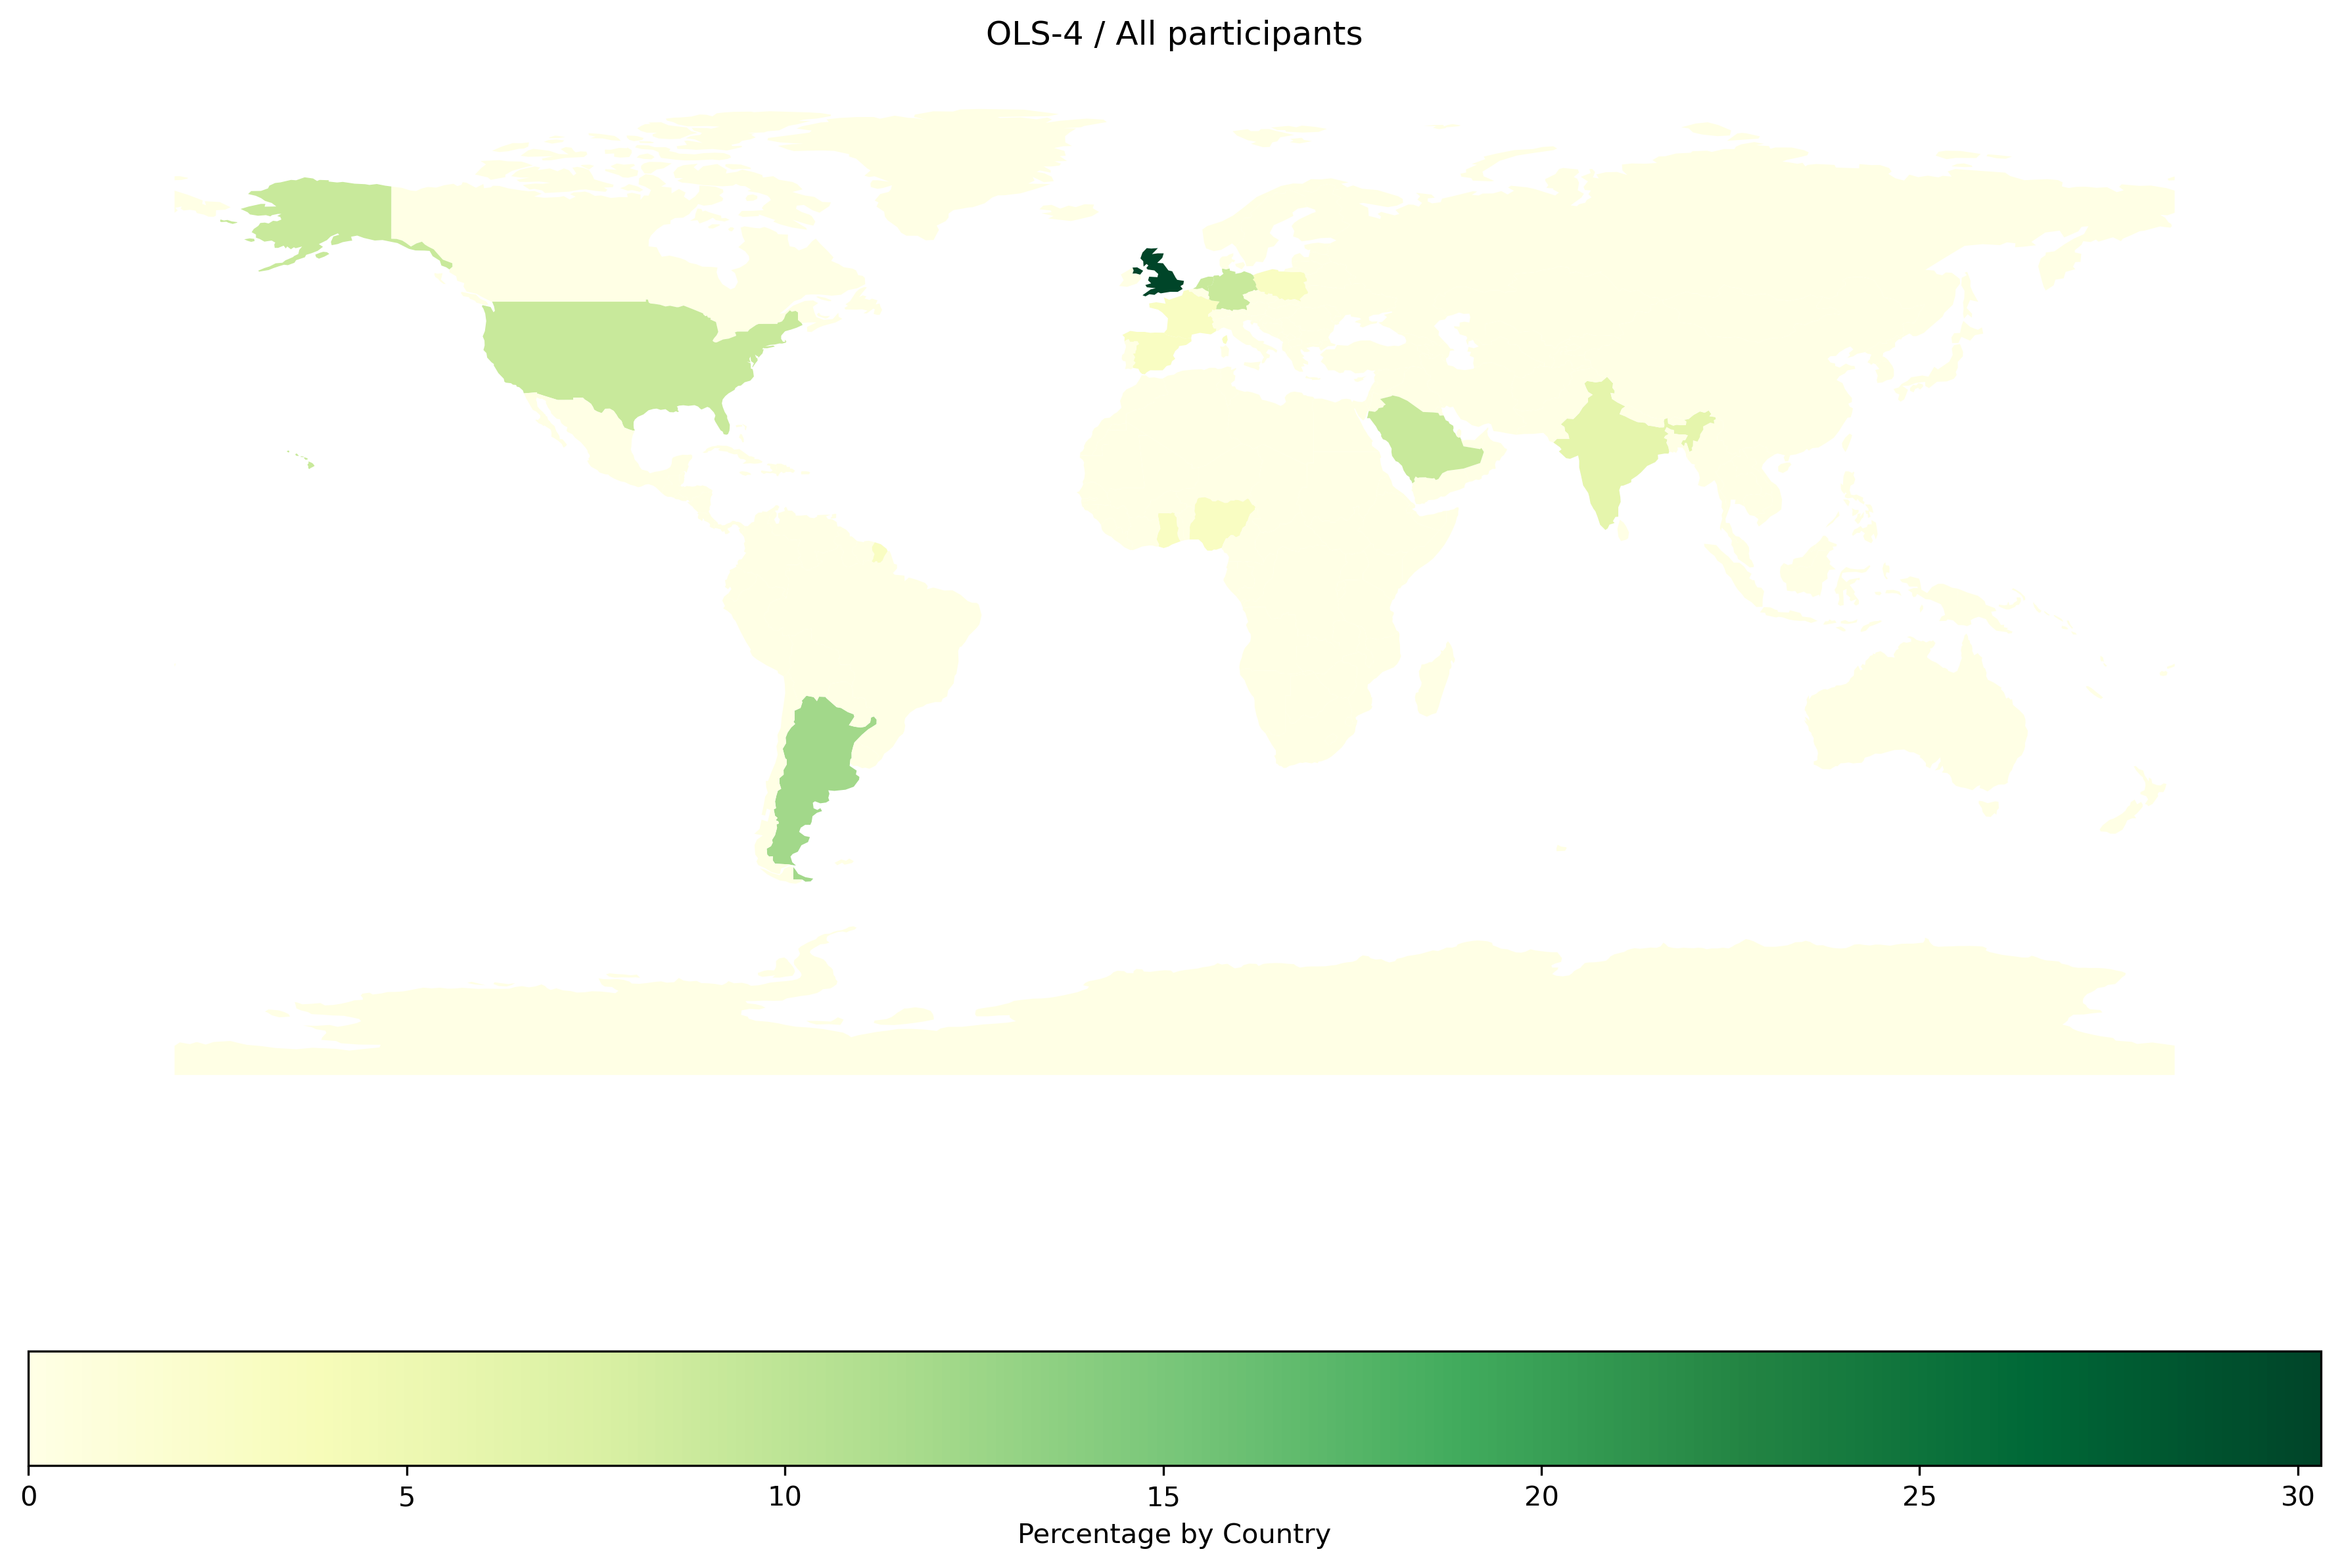
OLS-4 |
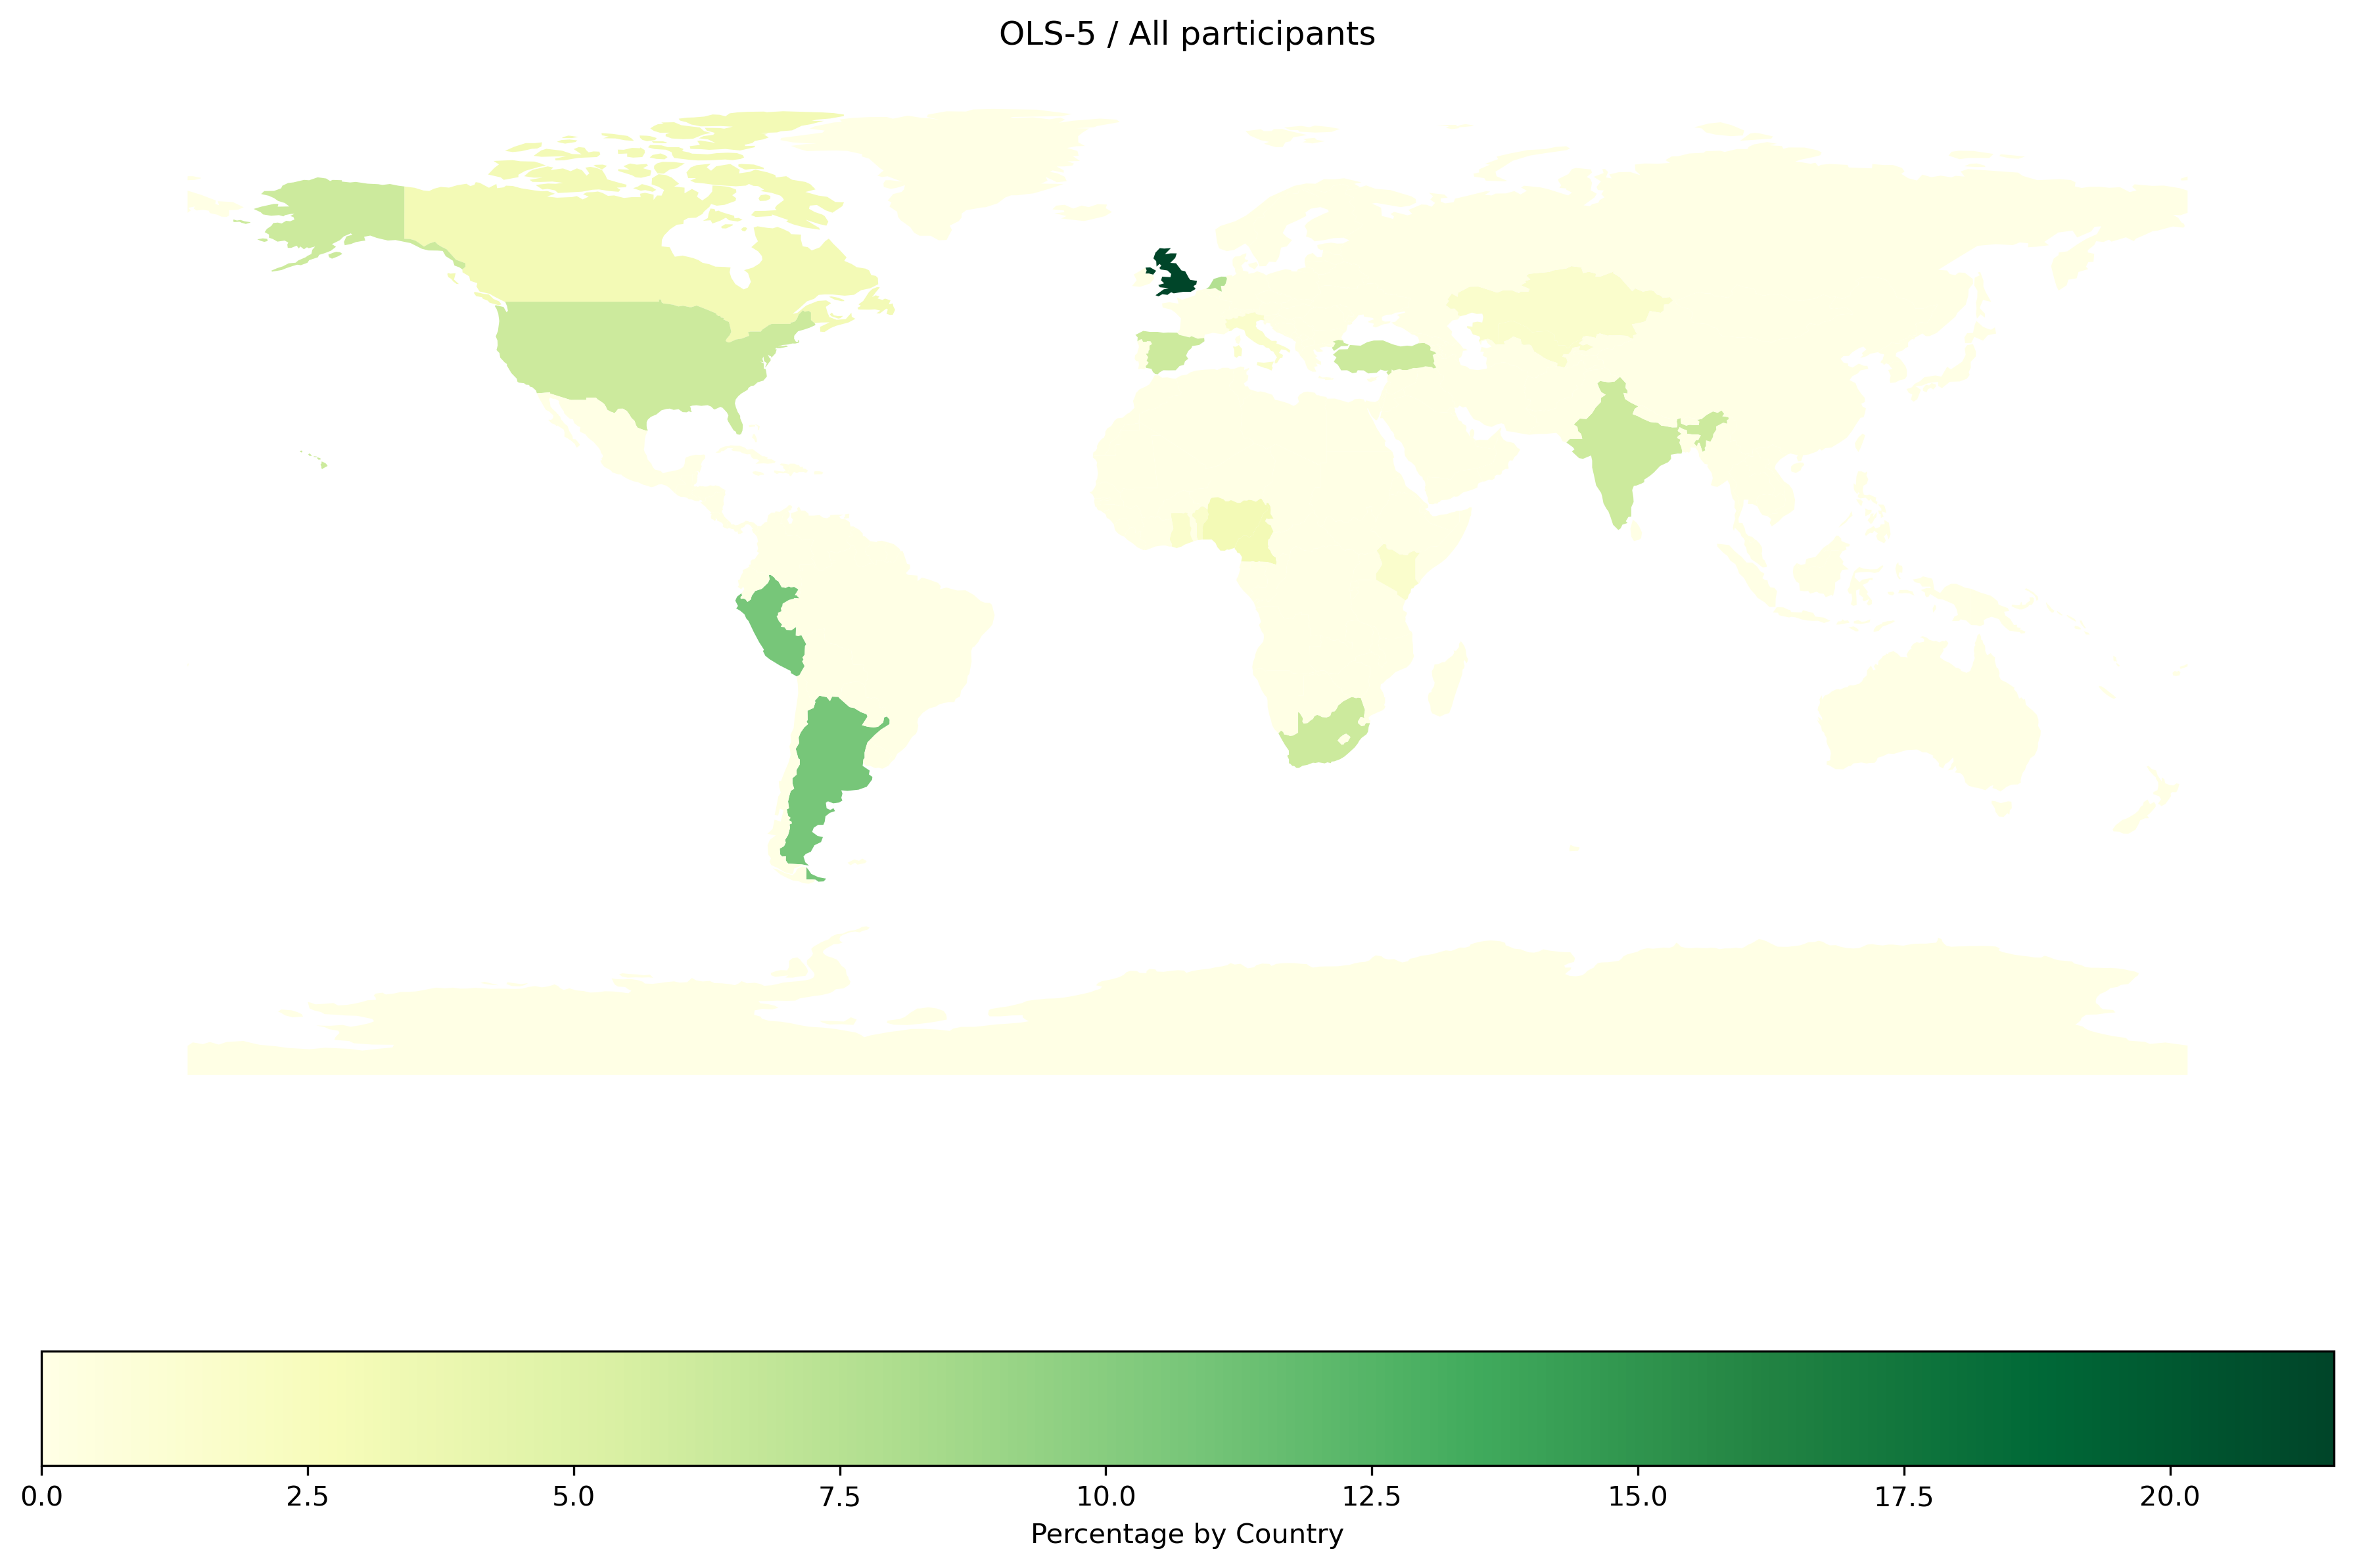
OLS-5 |
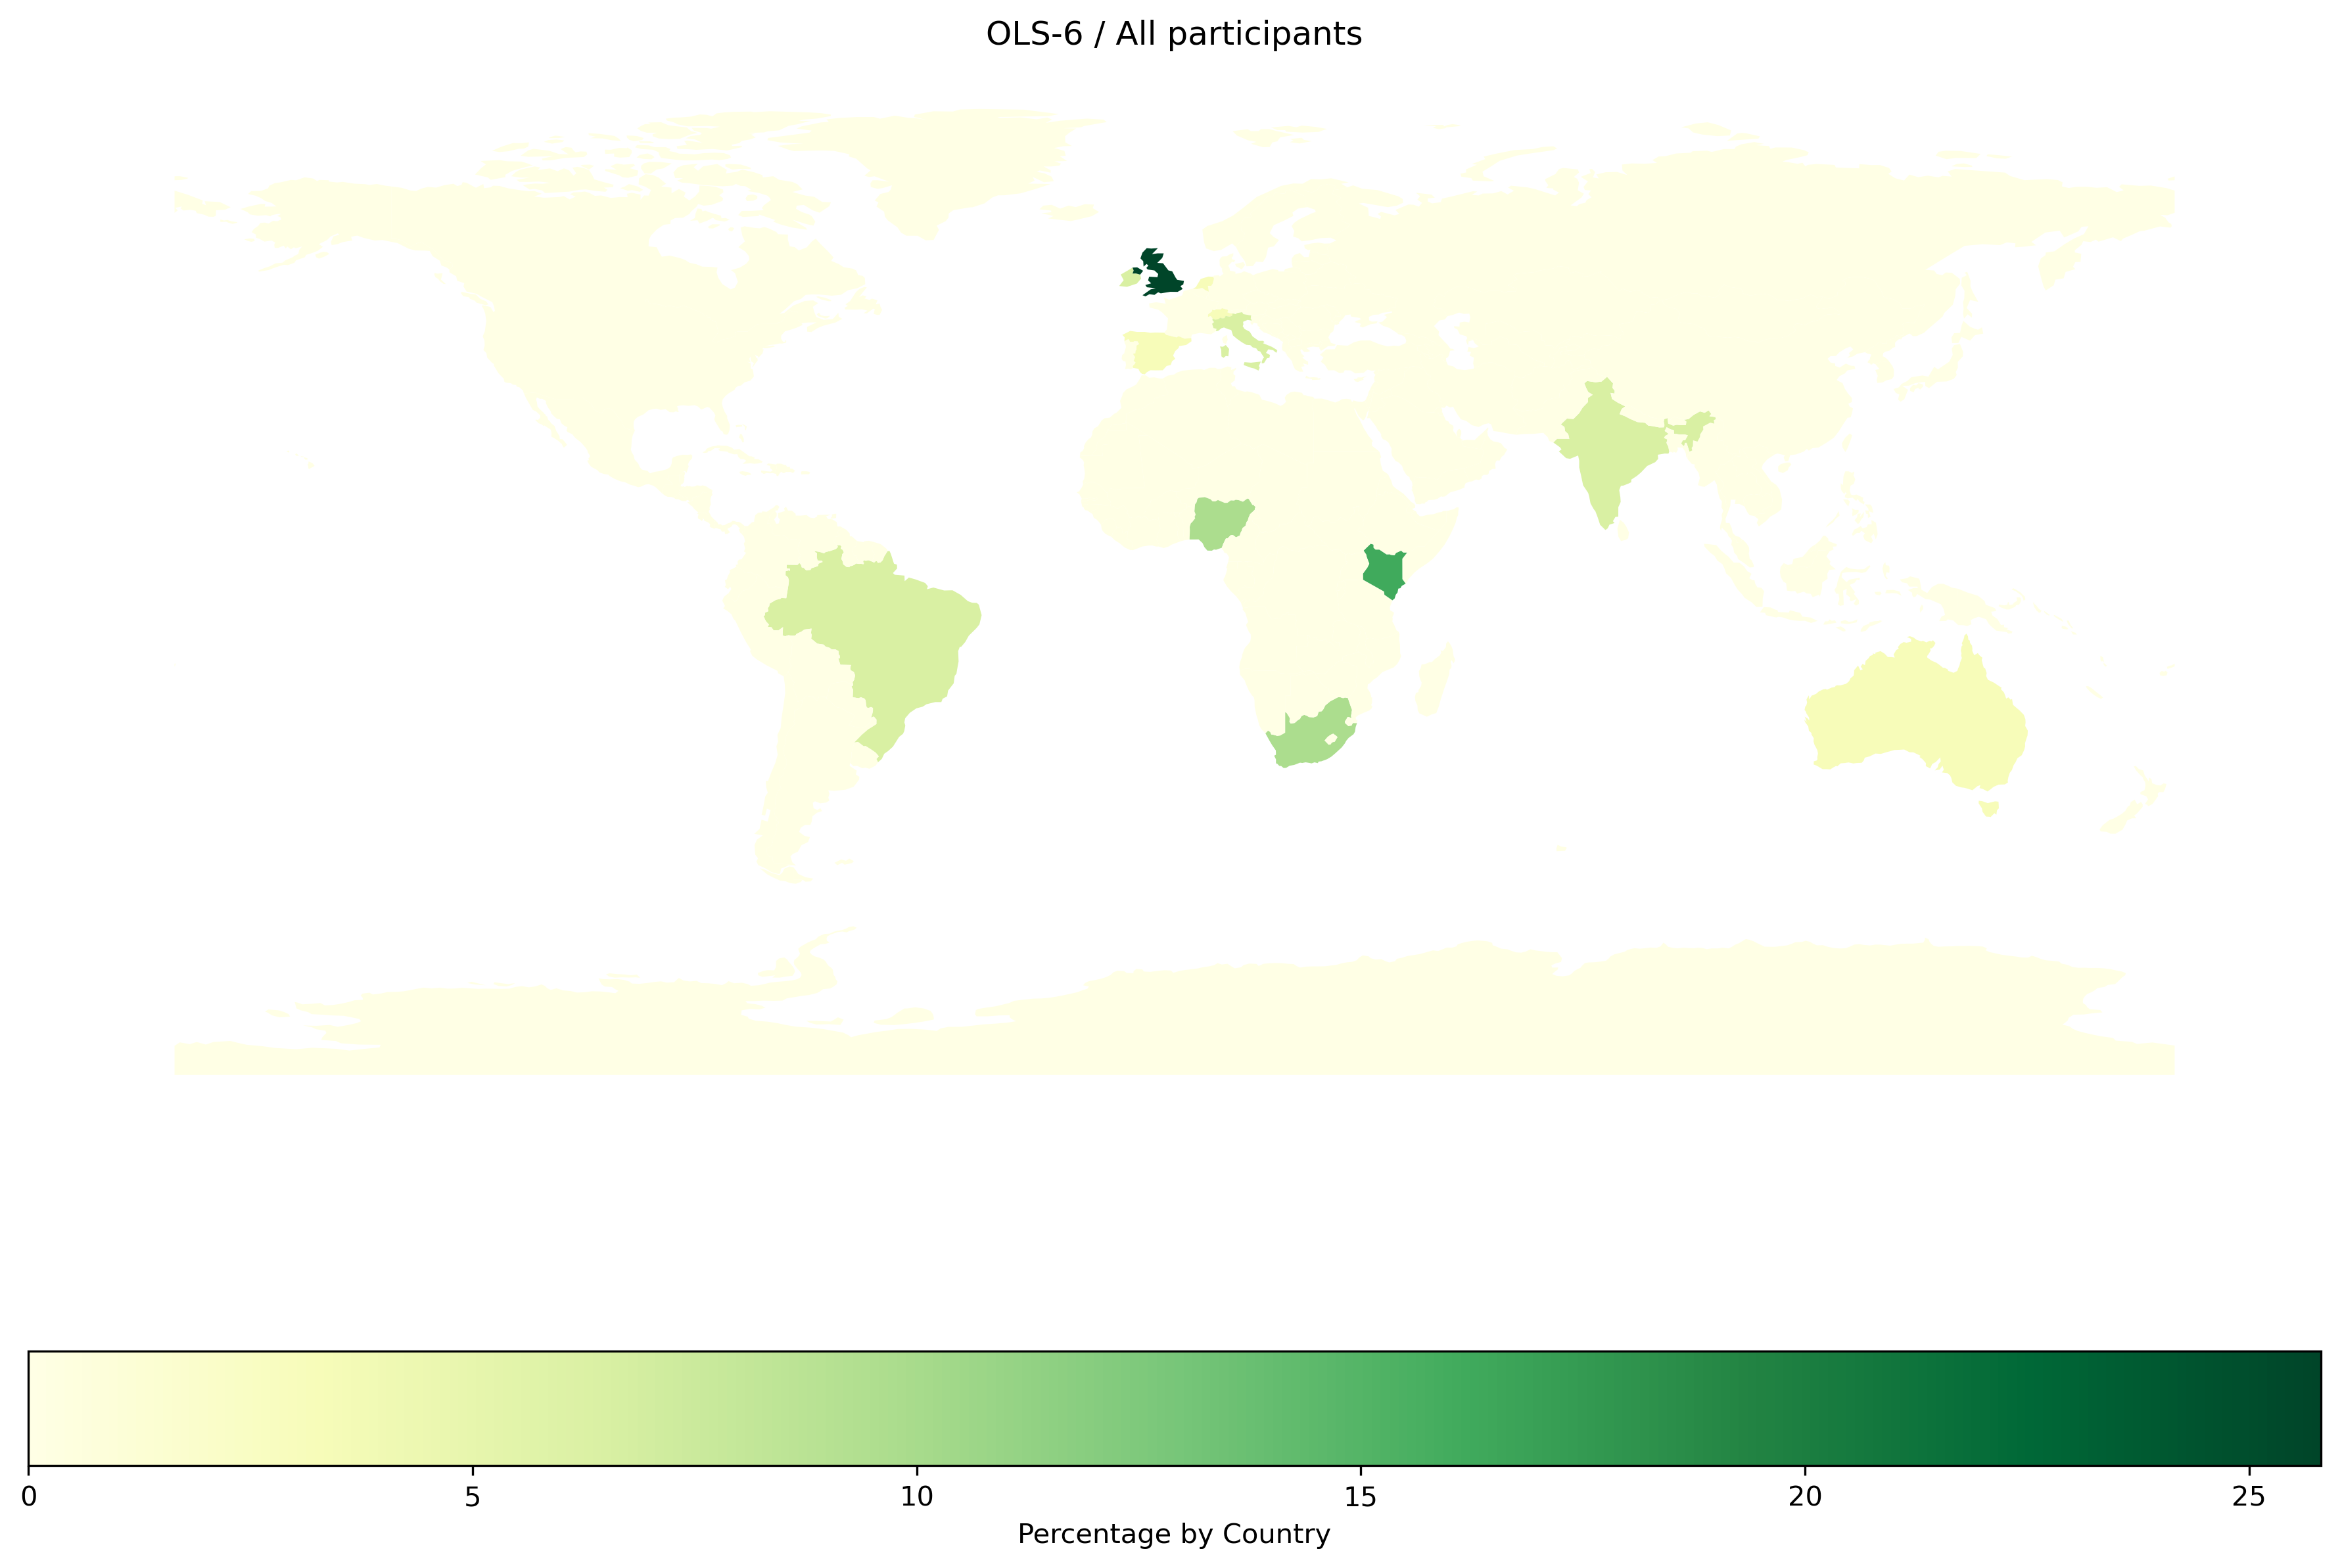
OLS-6 |
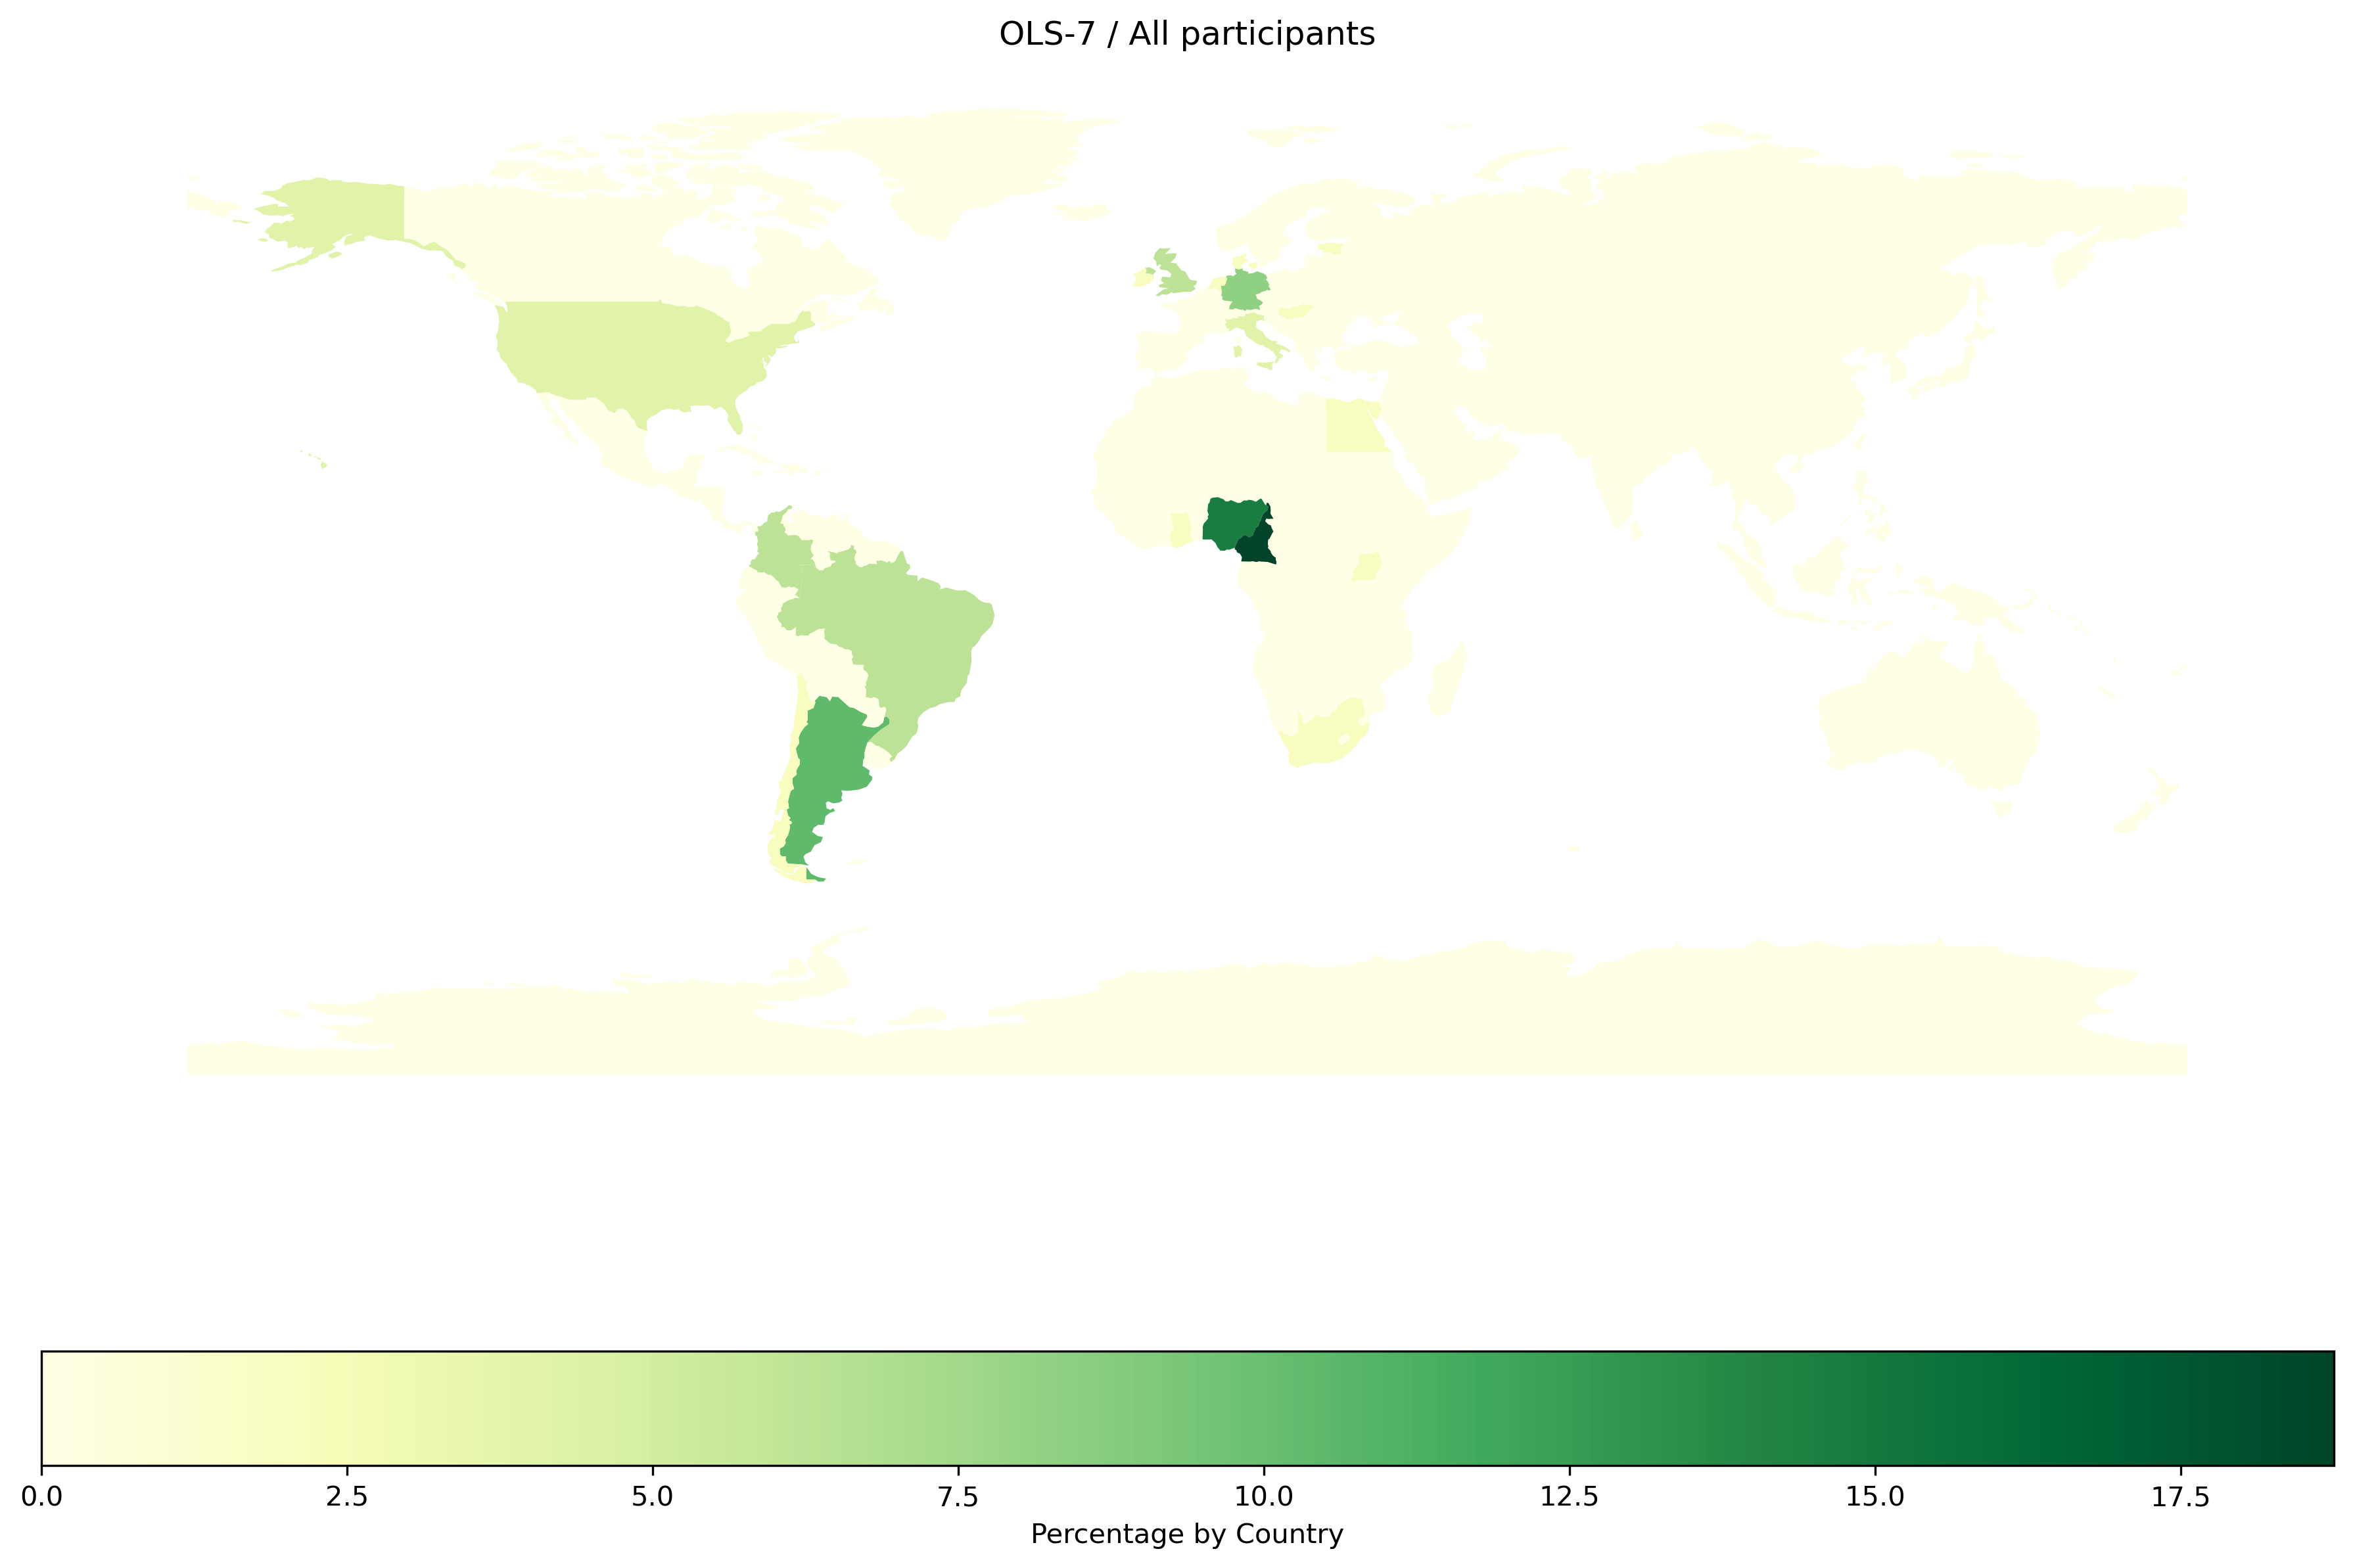
OLS-7 |
OLS-8 |
| country |
|
|
|
|
|
|
|
|
|
| Argentina |
5.836576 |
0.000000 |
1.470588 |
1.428571 |
3.921569 |
6.766917 |
3.061224 |
8.163265 |
15.909091 |
| Australia |
1.750973 |
1.282051 |
3.676471 |
2.857143 |
1.960784 |
0.751880 |
1.020408 |
2.040816 |
0.000000 |
| Austria |
0.194553 |
0.000000 |
0.735294 |
0.000000 |
0.000000 |
0.000000 |
0.000000 |
0.000000 |
0.000000 |
| Bangladesh |
0.194553 |
0.000000 |
0.735294 |
0.000000 |
0.000000 |
0.000000 |
0.000000 |
0.000000 |
0.000000 |
| Belgium |
0.389105 |
0.000000 |
0.000000 |
1.428571 |
0.000000 |
0.000000 |
0.000000 |
0.000000 |
0.000000 |
| Benin |
0.194553 |
0.000000 |
0.000000 |
0.000000 |
0.000000 |
0.751880 |
0.000000 |
0.000000 |
0.000000 |
| Bolivia |
0.000000 |
0.000000 |
0.000000 |
0.000000 |
0.000000 |
3.007519 |
0.000000 |
0.000000 |
0.000000 |
| Brazil |
3.112840 |
5.128205 |
2.941176 |
1.428571 |
1.960784 |
2.255639 |
4.081633 |
4.081633 |
1.515152 |
| Cameroon |
2.140078 |
0.000000 |
0.000000 |
0.714286 |
0.000000 |
1.503759 |
2.040816 |
9.183673 |
3.030303 |
| Canada |
2.918288 |
5.128205 |
7.352941 |
2.142857 |
0.980392 |
3.007519 |
2.040816 |
2.040816 |
0.757576 |
| Chile |
0.389105 |
0.000000 |
0.000000 |
0.000000 |
0.000000 |
0.000000 |
0.000000 |
2.040816 |
0.757576 |
| China |
0.194553 |
1.282051 |
0.735294 |
0.000000 |
0.000000 |
0.751880 |
1.020408 |
0.000000 |
0.000000 |
| Colombia |
0.778210 |
0.000000 |
0.000000 |
0.714286 |
0.980392 |
0.751880 |
2.040816 |
4.081633 |
2.272727 |
| Czechia |
0.778210 |
0.000000 |
0.735294 |
2.142857 |
0.000000 |
0.000000 |
0.000000 |
0.000000 |
0.000000 |
| Denmark |
0.389105 |
0.000000 |
0.000000 |
0.000000 |
0.000000 |
0.000000 |
0.000000 |
1.020408 |
0.757576 |
| Egypt |
0.194553 |
0.000000 |
0.000000 |
0.000000 |
0.000000 |
0.000000 |
0.000000 |
1.020408 |
0.000000 |
| Estonia |
0.389105 |
0.000000 |
0.000000 |
0.714286 |
0.000000 |
0.000000 |
0.000000 |
1.020408 |
0.757576 |
| Eswatini |
0.194553 |
0.000000 |
0.000000 |
0.000000 |
0.000000 |
0.000000 |
0.000000 |
0.000000 |
0.757576 |
| Ethiopia |
0.194553 |
0.000000 |
0.735294 |
0.000000 |
0.000000 |
0.000000 |
0.000000 |
0.000000 |
0.000000 |
| France |
2.334630 |
3.846154 |
4.411765 |
3.571429 |
5.882353 |
1.503759 |
1.020408 |
3.061224 |
3.030303 |
| Germany |
6.809339 |
10.256410 |
8.088235 |
10.000000 |
7.843137 |
6.766917 |
5.102041 |
7.142857 |
3.787879 |
| Ghana |
0.778210 |
0.000000 |
0.735294 |
0.714286 |
0.980392 |
1.503759 |
0.000000 |
1.020408 |
0.000000 |
| Greece |
0.583658 |
2.564103 |
1.470588 |
1.428571 |
0.980392 |
0.751880 |
1.020408 |
0.000000 |
0.757576 |
| Hungary |
0.194553 |
0.000000 |
0.000000 |
0.000000 |
0.000000 |
0.000000 |
0.000000 |
1.020408 |
0.000000 |
| India |
3.696498 |
2.564103 |
0.735294 |
5.714286 |
3.921569 |
3.007519 |
3.061224 |
1.020408 |
0.757576 |
| Indonesia |
0.972763 |
0.000000 |
0.735294 |
2.857143 |
0.000000 |
0.000000 |
0.000000 |
0.000000 |
0.000000 |
| Ireland |
0.972763 |
0.000000 |
0.000000 |
0.714286 |
0.000000 |
0.000000 |
2.040816 |
4.081633 |
0.757576 |
| Italy |
1.945525 |
1.282051 |
0.735294 |
2.857143 |
1.960784 |
0.751880 |
4.081633 |
2.040816 |
0.757576 |
| Japan |
0.194553 |
1.282051 |
0.000000 |
0.000000 |
0.000000 |
0.000000 |
0.000000 |
0.000000 |
0.000000 |
| Kazakhstan |
0.194553 |
0.000000 |
0.000000 |
0.000000 |
0.000000 |
0.751880 |
0.000000 |
0.000000 |
0.000000 |
| Kenya |
4.280156 |
7.692308 |
4.411765 |
1.428571 |
1.960784 |
3.007519 |
9.183673 |
8.163265 |
8.333333 |
| Luxembourg |
0.194553 |
1.282051 |
0.000000 |
0.000000 |
0.000000 |
0.000000 |
0.000000 |
0.000000 |
0.000000 |
| Mali |
0.389105 |
0.000000 |
1.470588 |
0.000000 |
0.000000 |
0.000000 |
0.000000 |
0.000000 |
0.000000 |
| Mexico |
0.389105 |
0.000000 |
0.735294 |
1.428571 |
0.980392 |
0.751880 |
1.020408 |
1.020408 |
0.757576 |
| Nepal |
0.778210 |
1.282051 |
0.000000 |
2.142857 |
0.000000 |
0.000000 |
0.000000 |
0.000000 |
0.000000 |
| Netherlands |
8.560311 |
3.846154 |
4.411765 |
3.571429 |
6.862745 |
6.766917 |
7.142857 |
5.102041 |
22.727273 |
| Nigeria |
3.891051 |
0.000000 |
1.470588 |
1.428571 |
0.980392 |
1.503759 |
3.061224 |
9.183673 |
9.090909 |
| Norway |
0.583658 |
2.564103 |
0.000000 |
0.000000 |
0.980392 |
0.751880 |
0.000000 |
0.000000 |
0.000000 |
| Peru |
1.361868 |
0.000000 |
0.000000 |
0.000000 |
0.000000 |
5.263158 |
0.000000 |
0.000000 |
0.000000 |
| Poland |
0.194553 |
0.000000 |
0.000000 |
0.000000 |
0.980392 |
0.000000 |
0.000000 |
0.000000 |
0.000000 |
| Portugal |
0.389105 |
0.000000 |
0.000000 |
1.428571 |
0.000000 |
0.000000 |
0.000000 |
0.000000 |
0.000000 |
| Romania |
0.194553 |
0.000000 |
0.000000 |
0.000000 |
0.000000 |
0.000000 |
0.000000 |
1.020408 |
0.757576 |
| Russian Federation |
0.194553 |
1.282051 |
0.000000 |
0.000000 |
0.000000 |
0.000000 |
0.000000 |
0.000000 |
0.000000 |
| Saudi Arabia |
0.778210 |
0.000000 |
0.000000 |
1.428571 |
2.941176 |
0.751880 |
1.020408 |
1.020408 |
0.000000 |
| South Africa |
3.891051 |
1.282051 |
4.411765 |
2.142857 |
0.000000 |
4.511278 |
5.102041 |
1.020408 |
3.787879 |
| South Korea |
0.000000 |
0.000000 |
0.000000 |
0.000000 |
0.000000 |
0.751880 |
1.020408 |
0.000000 |
0.000000 |
| Spain |
3.112840 |
1.282051 |
2.205882 |
6.428571 |
1.960784 |
3.759398 |
1.020408 |
0.000000 |
1.515152 |
| Sweden |
0.389105 |
0.000000 |
0.735294 |
0.000000 |
0.980392 |
0.751880 |
1.020408 |
0.000000 |
0.757576 |
| Switzerland |
1.750973 |
1.282051 |
4.411765 |
1.428571 |
1.960784 |
0.751880 |
3.061224 |
1.020408 |
0.757576 |
| Thailand |
0.194553 |
1.282051 |
0.000000 |
0.000000 |
0.980392 |
0.000000 |
0.000000 |
0.000000 |
0.000000 |
| Turkey |
0.972763 |
0.000000 |
0.735294 |
1.428571 |
0.000000 |
3.759398 |
0.000000 |
0.000000 |
0.000000 |
| Uganda |
0.389105 |
0.000000 |
0.735294 |
0.000000 |
0.000000 |
0.000000 |
0.000000 |
1.020408 |
0.757576 |
| United Kingdom |
18.287938 |
21.794872 |
27.941176 |
25.000000 |
28.431373 |
24.060150 |
29.591837 |
11.224490 |
10.606061 |
| United Kingdom / Ukraine |
0.000000 |
0.000000 |
0.000000 |
0.000000 |
0.000000 |
0.000000 |
0.000000 |
1.020408 |
0.000000 |
| United States |
9.533074 |
20.512821 |
10.294118 |
9.285714 |
18.627451 |
7.518797 |
6.122449 |
5.102041 |
3.030303 |
| Uruguay |
0.194553 |
0.000000 |
0.000000 |
0.000000 |
0.000000 |
0.000000 |
0.000000 |
0.000000 |
0.757576 |
| Uzbekistan |
0.194553 |
0.000000 |
0.000000 |
0.000000 |
0.000000 |
0.751880 |
0.000000 |
0.000000 |
0.000000 |
Maps
Participants
Number of countries